View Activity Logs
- Capella Operational
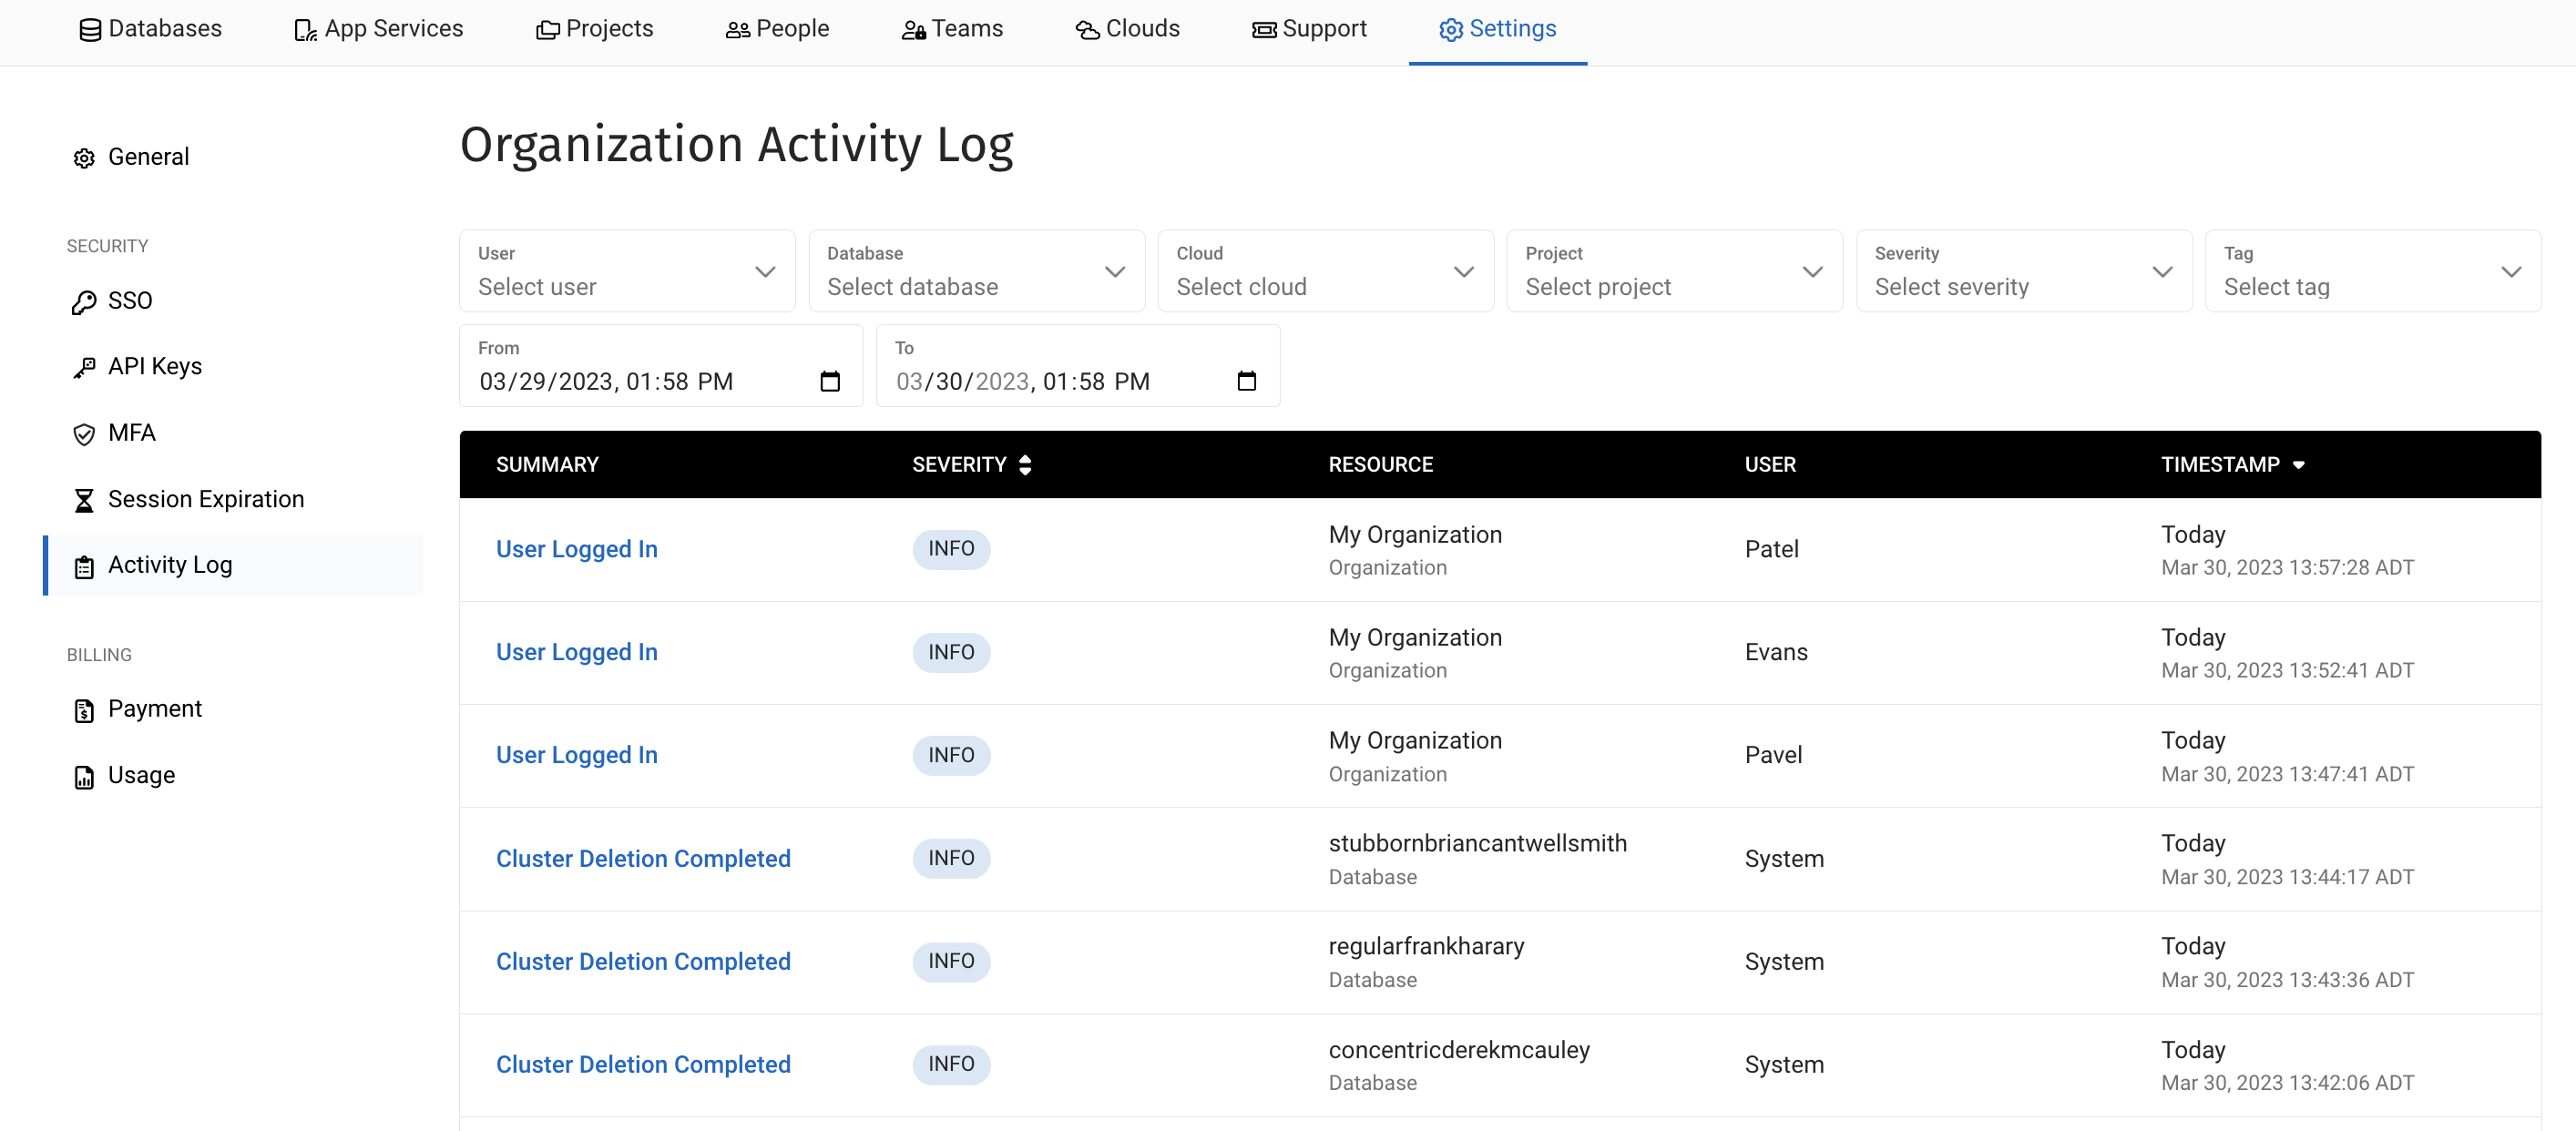
Capella Activity Logs provide audit trails of events in your organization, project, and cluster.
Prerequisites
To view an activity log, filter it, and view its events, you need:
-
A project role in any project where you want to see events generated from its clusters.
View an Activity Log
To view an activity log in the Capella UI:
-
Open the organization, project, or cluster where you want to view the activity log.
-
Click the Settings tab.
-
In the navigation menu, click Activity Log.
Activity Logs show a running log of events for the chosen scope. Each event includes details about when, where, and if relevant, why the event occurred.

Activity Logs include the following information for each logged event:
| Field | Description |
|---|---|
Summary |
The title of the event. Clicking the summary opens an event details page. |
Severity |
The severity of the event. Each event has one severity level: Info, Warning, or Critical. See Events for more information. |
Resource |
The Capella resource where the event occurred. Resources can include specific organizations, projects, clusters, or App Services. |
User |
Who initiated the event. The user can be someone in your organization or "System" representing system-originating events. |
Timestamp |
The date and time of the event. Timestamps include the date and your local time when the event occurred and how many days, weeks, or months ago it was. All time in the Activity Log is in your local time. |
Filter Activity Logs
Use filtering to choose what events appear in an Activity Log based on the user, cluster, project, event severity, event tag, and time range. You can combine multiple filters to narrow down what you’re looking for. The available filters depend on which Activity Log you’re viewing. For example, when viewing the Activity Log for a cluster you won’t be able to filter by cluster or project.
- Filter by time range
-
Use the From and To date and time pickers to choose a time range where you want to see activity. All time in the Activity Log is in your local time.
- Filter by user
-
Choose a user whose initiated events you want to see.
- Filter by cluster
-
Choose a cluster from which you want to see events.
- Filter by project
-
Choose the project from which you want to see events. This includes events from every cluster within the chosen project.
- Filter by severity
-
Choose the severity of the events you want to see.
- Filter by event tag
-
Choose the tag of the events you want to see.
To remove a specific filter, deselect the attribute from its related list. Refreshing the page removes all of the filters applied to an Activity Log.
For a list of all the alerts that appear in the Activity Log and their tags, see Alert Reference.
View Events
To view the details of an event shown in the Activity Log, click the event’s name.

Events with the Info severity typically include fewer details. Events with the Warning or Critical severity can include more information to assist in resolving the issue.
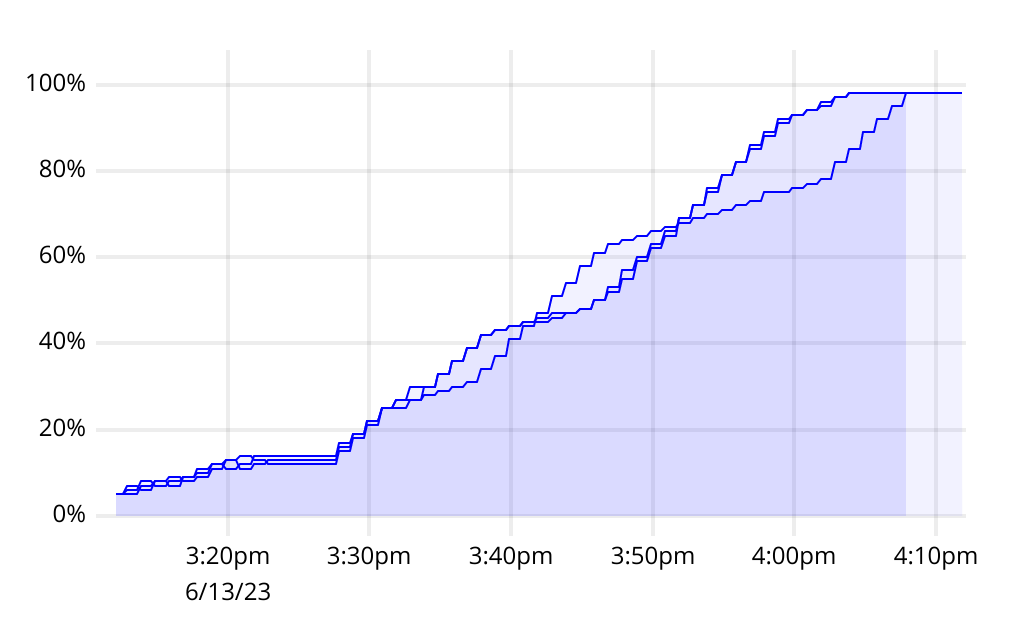
When viewing an event, clicking the cluster name opens the cluster where the event occurred. The Open chart image link opens a metrics chart in a new browser tab. This chart shows metrics related to the event for the time period before and when the event occurred:

Every event you view has a Create Support Ticket button to create a support ticket related to that open event.