Explore iQ Insights
- Capella Operational
- concept
iQ Insights uses the power of AI to provide you with key insights into your query results. Use it to better understand your data with generated questions and visualizations.
iQ Insights uses the power of Large Language Models (LLMs) to generate valuable insights from your query results. By integrating AI with your data, iQ Insights can automatically generate relevant questions based on your query outcomes. These questions are then answered with descriptions and data visualizations, offering you a deeper analysis of your results to enhance your understanding of your data.
Use Capella iQ to create SQL++ queries based on your natural language questions and use iQ Insights to get better insights from the data in your query results.
iQ Insights is available on all plans for Capella operational and Capella Columnar clusters. You can find it as a part of Capella’s query editor and Capella Columnar’s workbench.
About iQ Insights
iQ Insights uses an LLM to suggest relevant questions based on your query results and generate responses with descriptions and visualizations. It analyzes and extracts the structure of your document schema from the JSON datasets of query results to generate relevant bar charts, line graphs, scatter plots, or other more complex visualizations.
Before you can use Capella iQ or iQ Insights, an Organization Owner must accept the Supplemental Terms.
Once the terms and conditions are accepted, all users in an organization can use Capella iQ and iQ Insights in any Capella operational and Columnar clusters.
By accepting the Supplemental Terms for Capella iQ, you also accept the terms for iQ Insights.
To disable iQ Insights, an Organization Owner must disable Capella iQ at the organizational level.
Disabling Capella iQ also disables iQ Insights.
For more information, see Turn Capella iQ Off for Your Organization.
|
Prerequisites
-
An organization owner has accepted the iQ Insights Supplemental Terms. For more information, see Privacy and Security.
-
You have deployed a Capella operational cluster or a Capella Columnar cluster. If you’re working with an operational cluster, it must have the Data, Query, and Index Service deployed on at least 1 Service Group.
-
Your queries must:
-
Either use a dataset with clear document names or have clear query projection names. iQ Insights will attempt to auto-infer your data but it needs meaningful data labels to create charts.
-
Use SELECT statements only. SELECT statements can include WITH and LIMIT clauses. Queries with any other statements or clauses are not supported.
-
Generate result sets that are within the 6 MB sizing limit and contain more than 1 document.
-
| If iQ Insights is producing errors, review the prerequisites and make sure your query follows the iQ Insights query guidelines before trying again. |
Generate Visualizations with iQ Insights
After you run SQL++ queries, select the iQ Insights tab in the query results pane and click Generate Now. This generates logical questions based on your query results and presents answers with various graphs and charts.
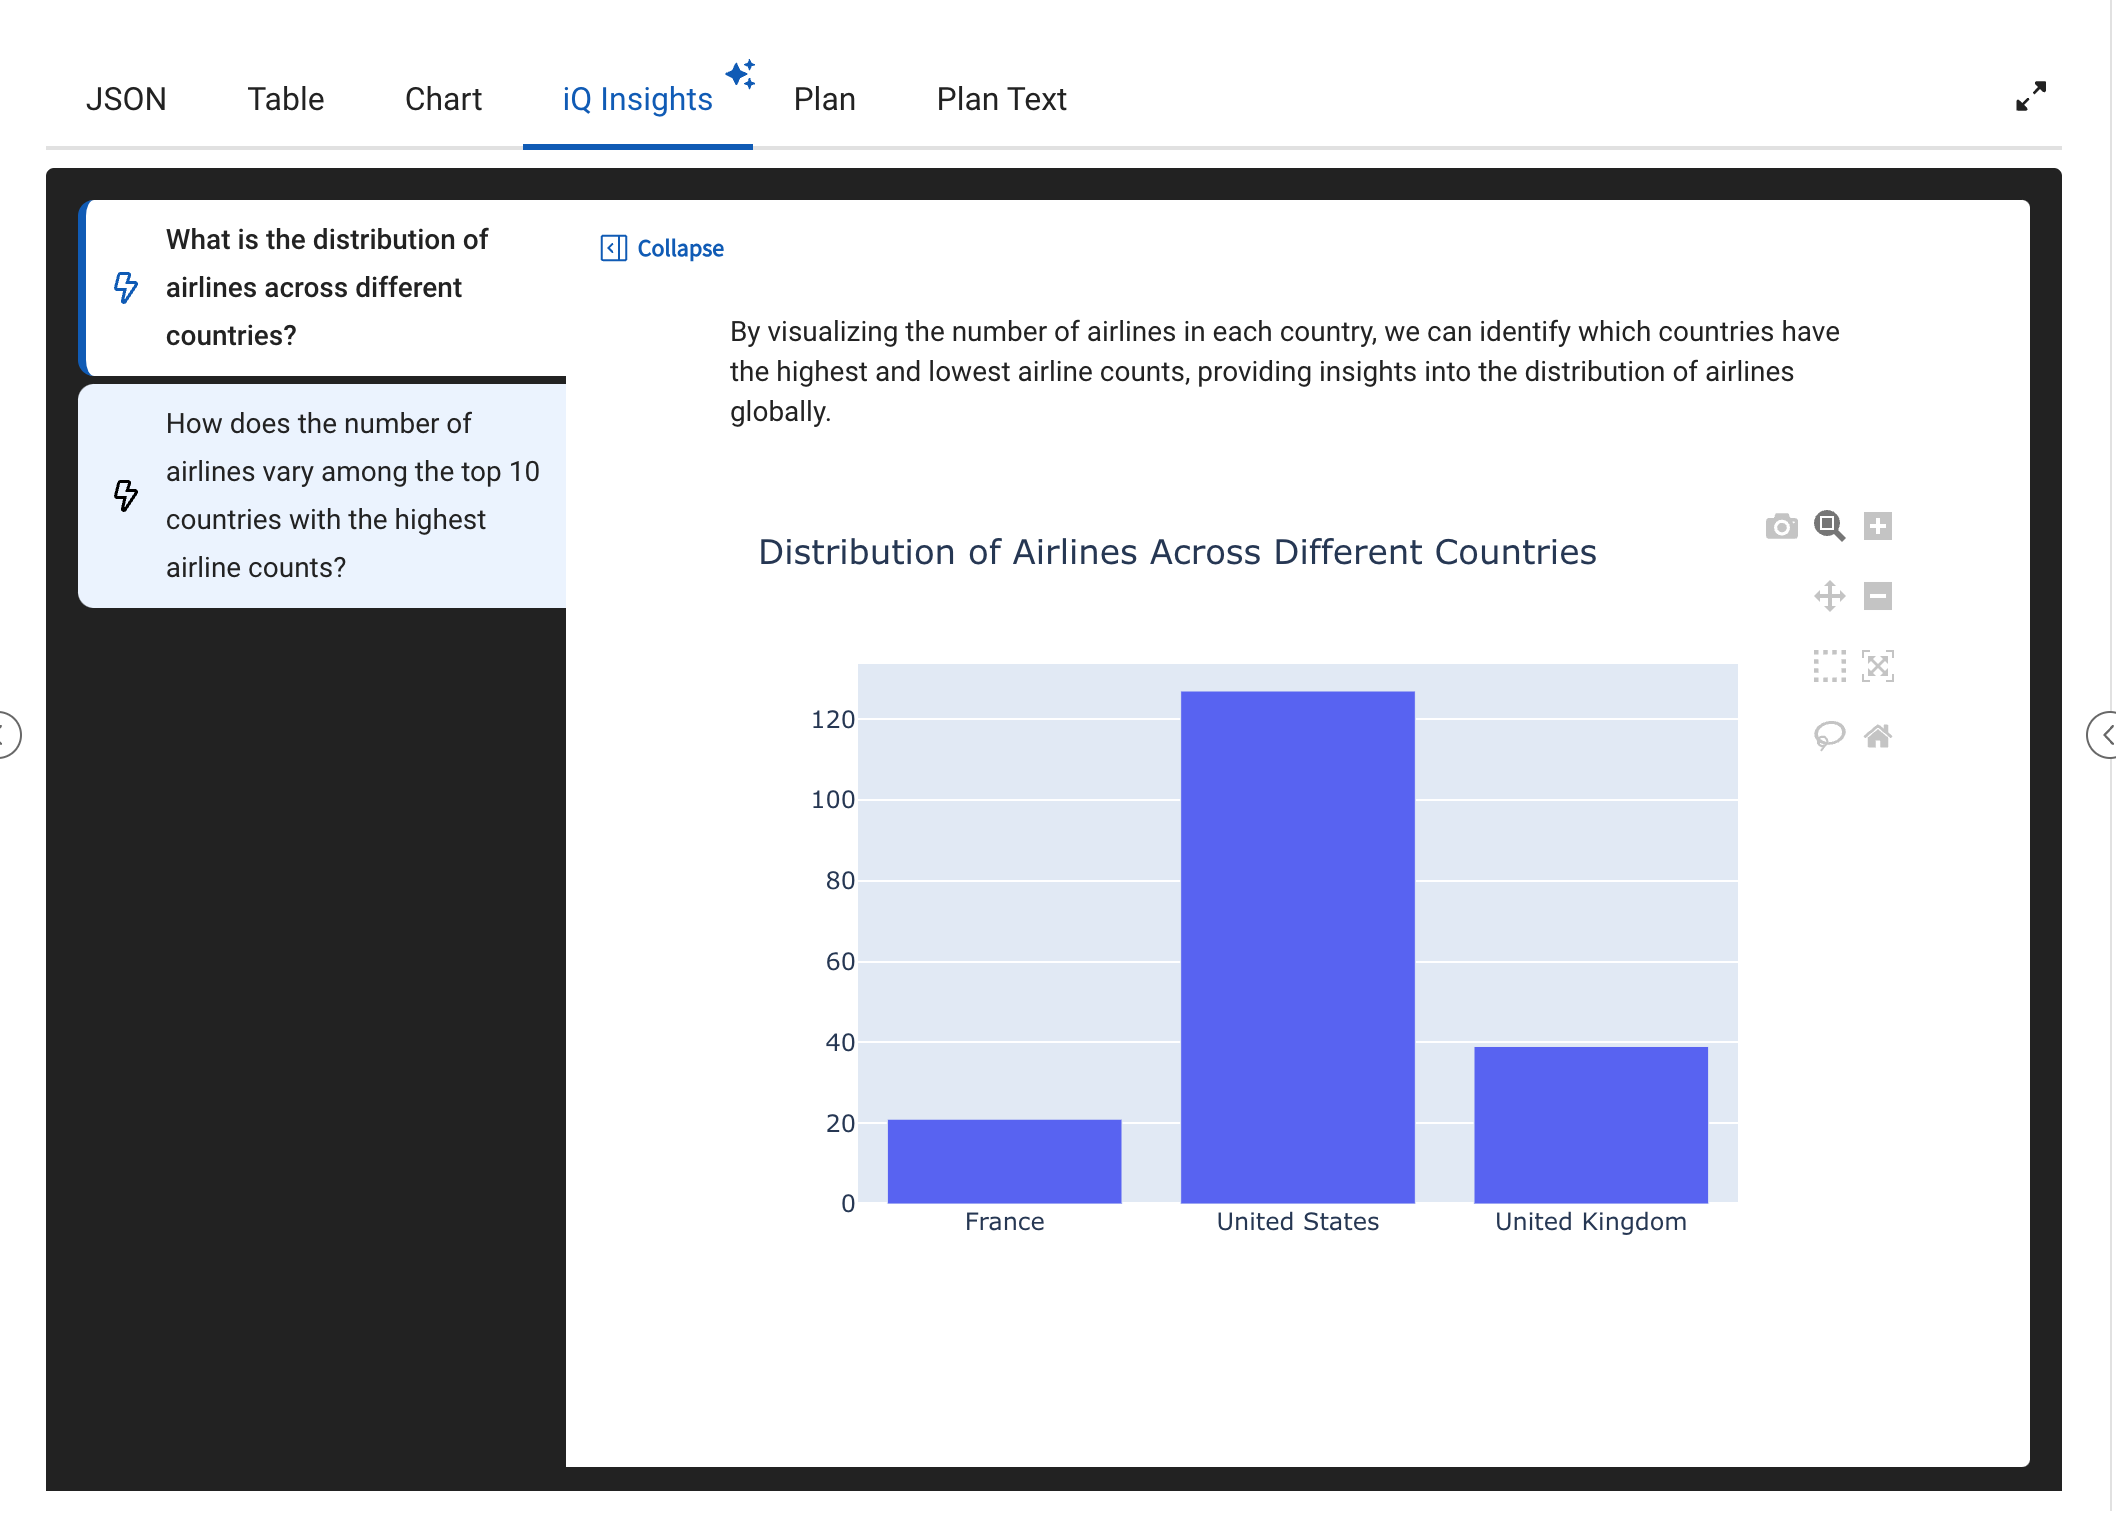
Following the travel-sample example from Generate SQL++ Queries, iQ Insights generates the following insights:

Based on the first generated question, the LLM could infer its response visually through a bar chart. Alongside the description, you can identify which countries have the highest and lowest airline counts.
You can choose and use the visualizations most useful to you. The UI allows you to export charts in PNG format, select areas using lasso or box selection, and zoom in or out of the visualizations.
iQ Insights is available to use with all SELECT queries, including those generated by Capella iQ.
|
Capella iQ provides two options for visualizations:
|
Privacy and Security
iQ Insights has the same privacy and security terms as Capella iQ. By accepting the Supplemental Terms for Capella iQ, you also accept the terms for iQ Insights. For more information about using OpenAI based tools in Couchbase Capella, see Privacy and Security.
As a user of iQ Insights, Couchbase would like to remind you that you share a responsibility when using this tool. Users of iQ Insights must keep the following in mind:
-
Do not generate a chart using confidential query results, such as personally identifiable information or any confidential information you would not want shared with a third party. See Privacy and Security for more information.
-
Verify the output of iQ Insights before using it. iQ Insights results are a visualization aid. LLMs can experience hallucinations and provide incorrect information from time to time.
-
Respect the use policies set out in the Couchbase Capella iQ Supplemental Terms.