Configure CMOS for On-premises deployment
- Developer Preview
|
Tutorials are provided to demonstrate how a particular problem may be solved. Tutorials are accurate at the time of writing but rely heavily on third party software. The third party software is not directly supported by Couchbase. For further help in the event of a problem, contact the relevant software maintainer. |
Overview
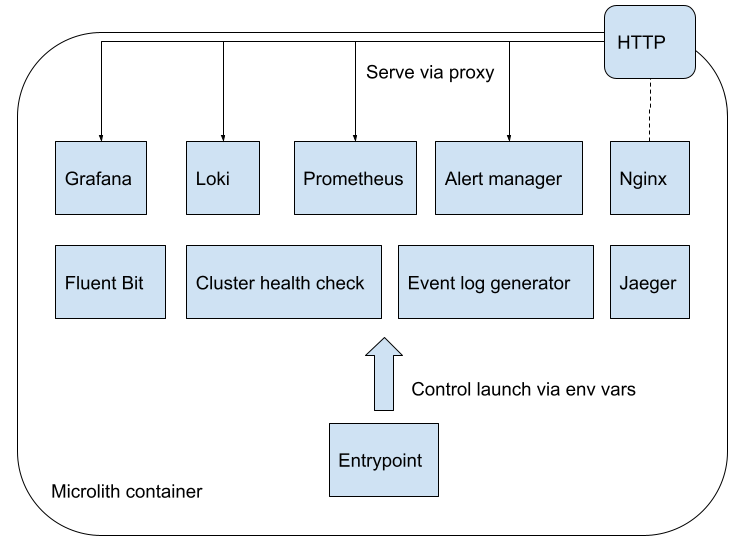
Couchbase Monitoring and Observability Stack (also known as CMOS) is a simple, out-of-the-box solution built using industry standard tooling to observe the state of a Couchbase cluster. CMOS can be deployed using Docker or any container runtime.
Installation
At this moment, we only support deployment of CMOS using containers. Use docker to start the CMOS container. Alternatively, you can also use Linux container tools such as Podman. To install CMOS run the command below:
docker run --name=cmos --rm -d -P couchbase/observability-stack:latestVerification
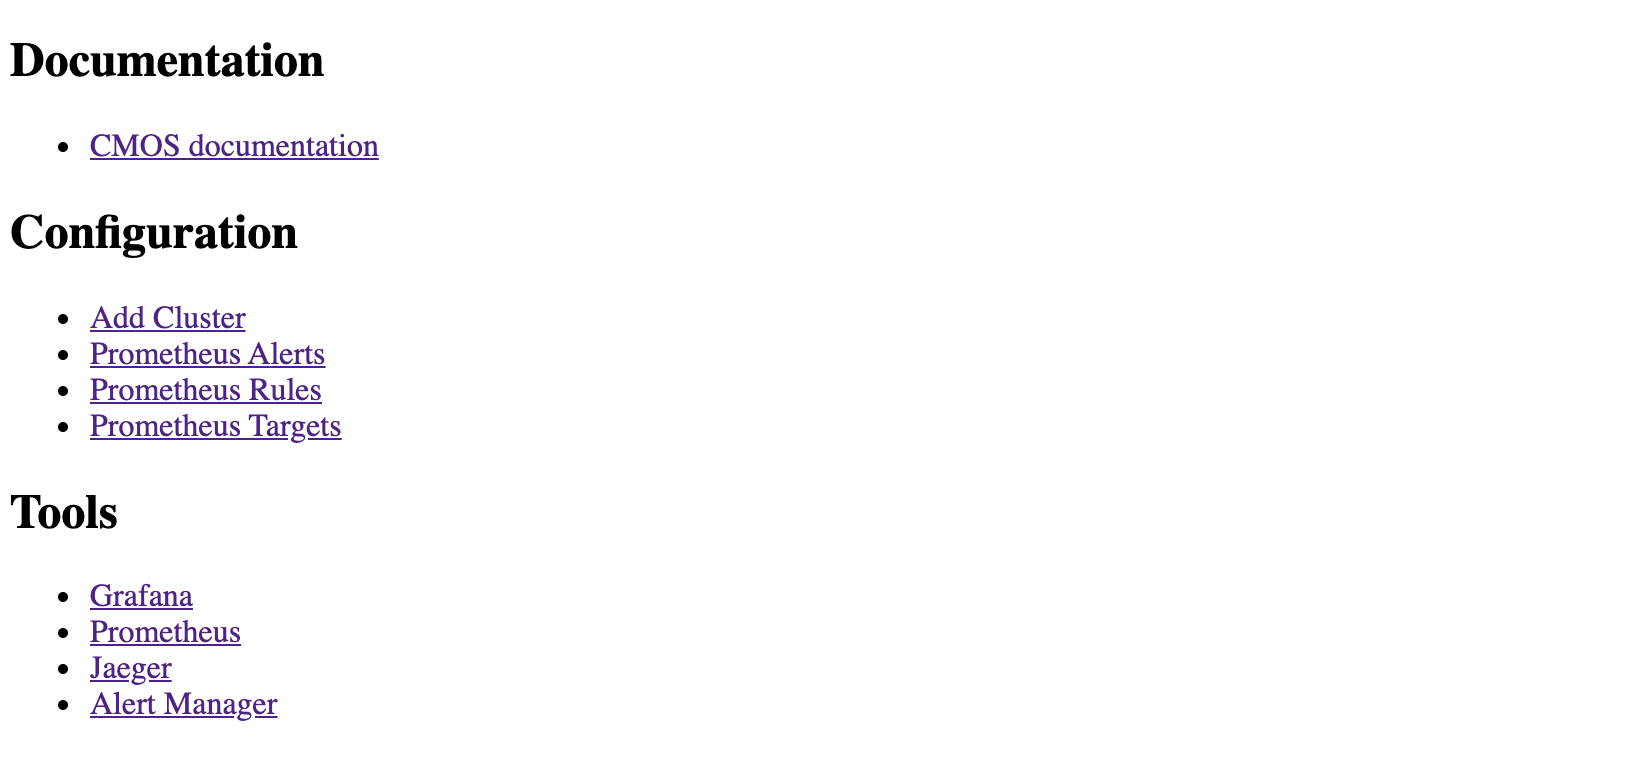
You can verify whether the CMOS container is up and running by navigating to the CMOS landing page on port 8080.
To check the port mapping in your host, run the command below:
docker container port cmos 8080# output 0.0.0.0:55124 :::55124
Add Cluster
If you don’t have an existing Couchbase cluster setup, you can install it from here. To monitor a Couchbase cluster, you can add it using the add cluster option on the landing page.
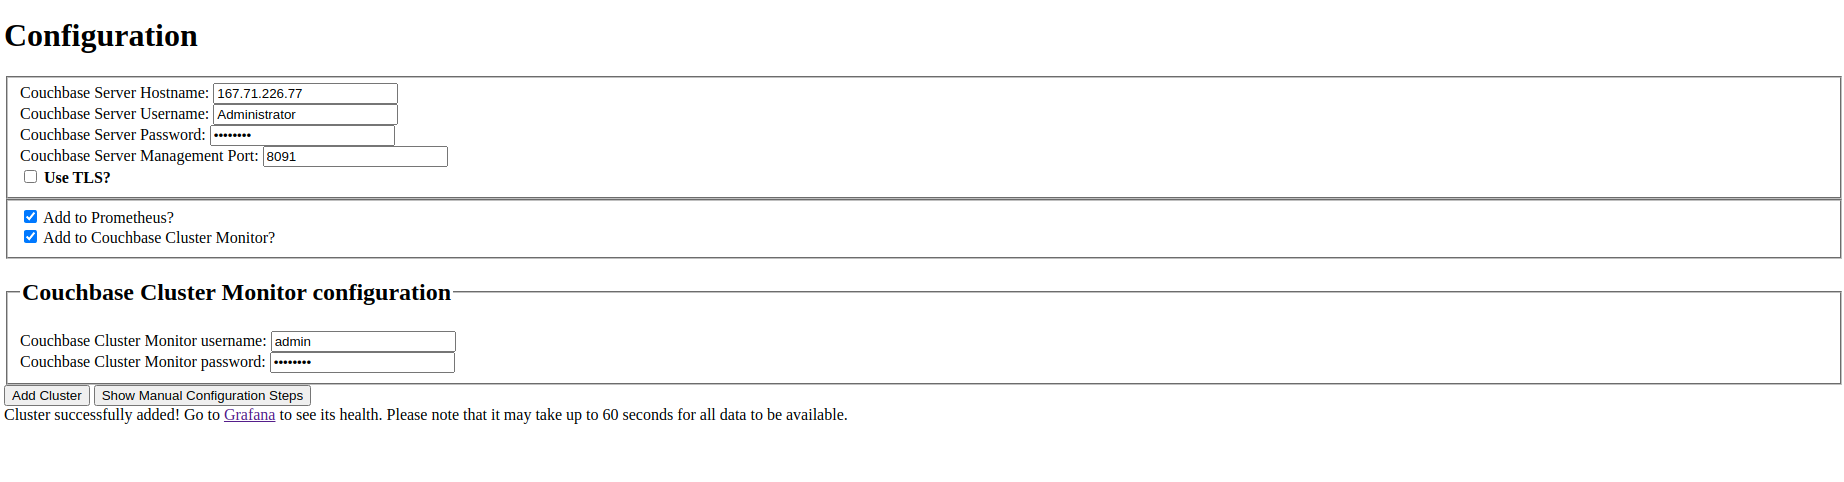
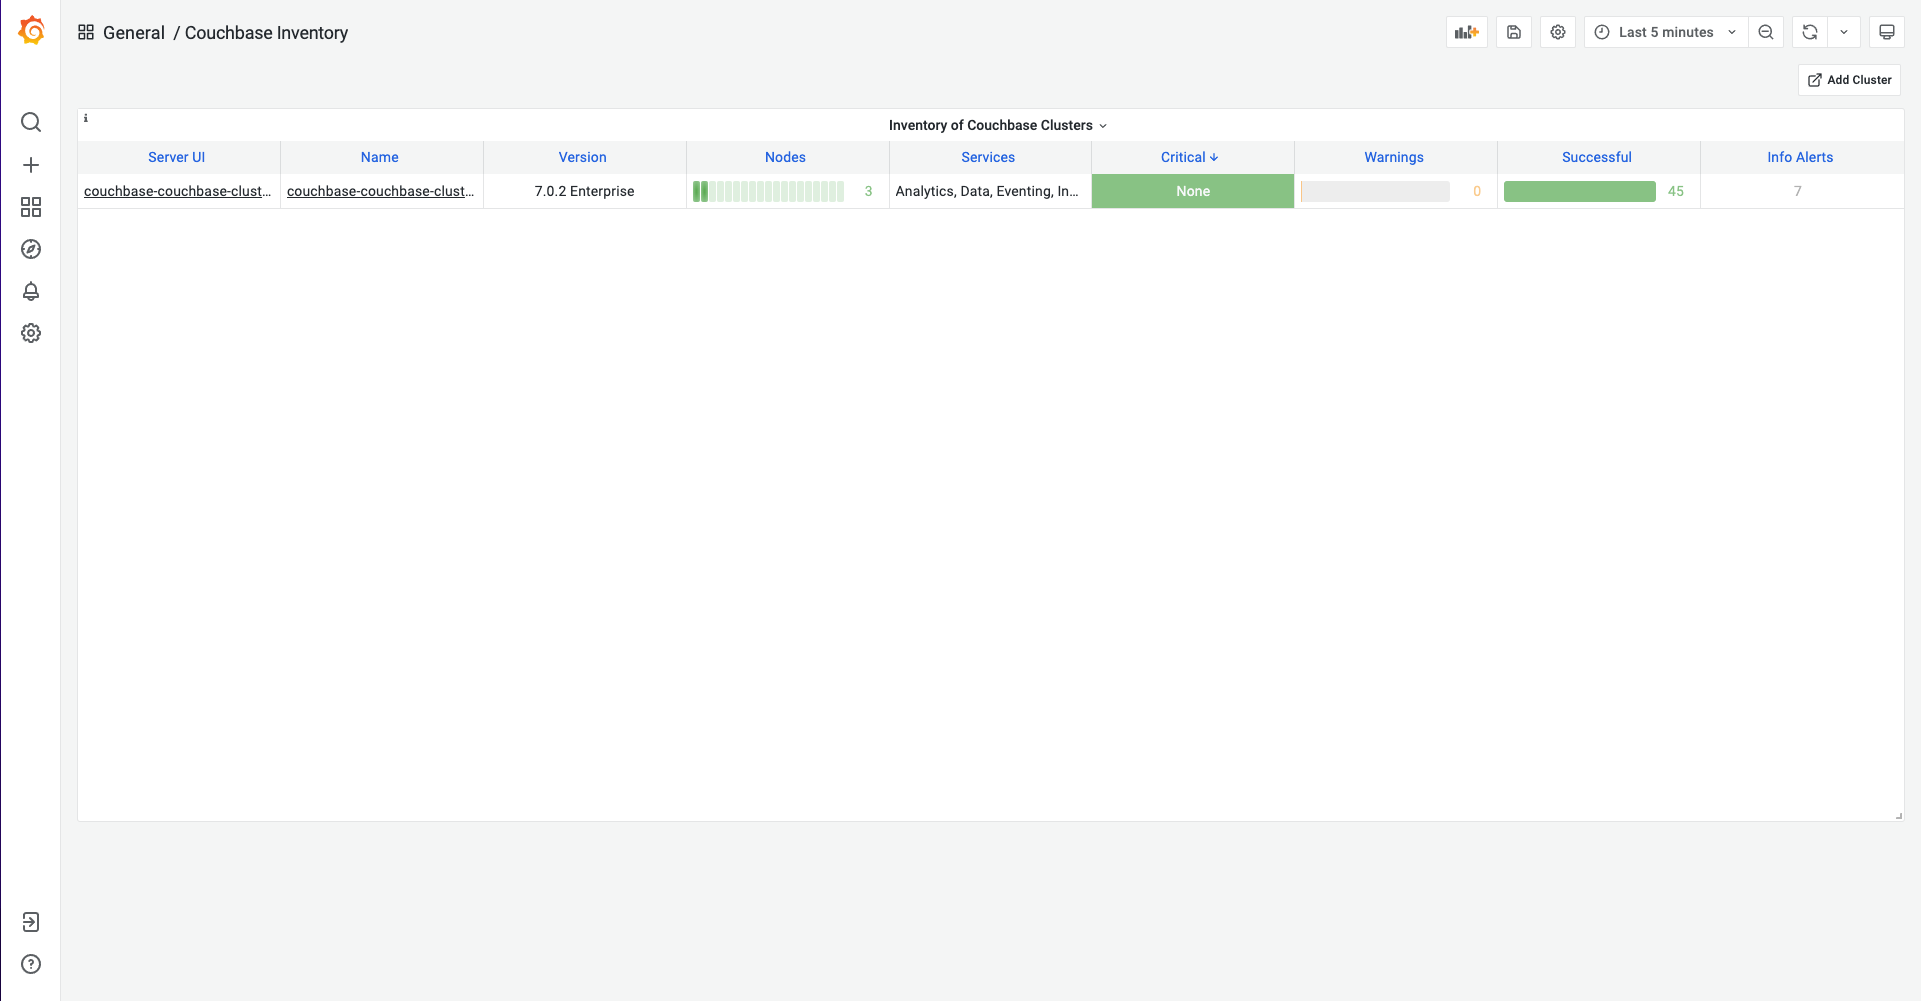
As soon as you add a cluster, you will see a Grafana URL where you can view inventory and metrics of Couchbase server clusters.
Prometheus
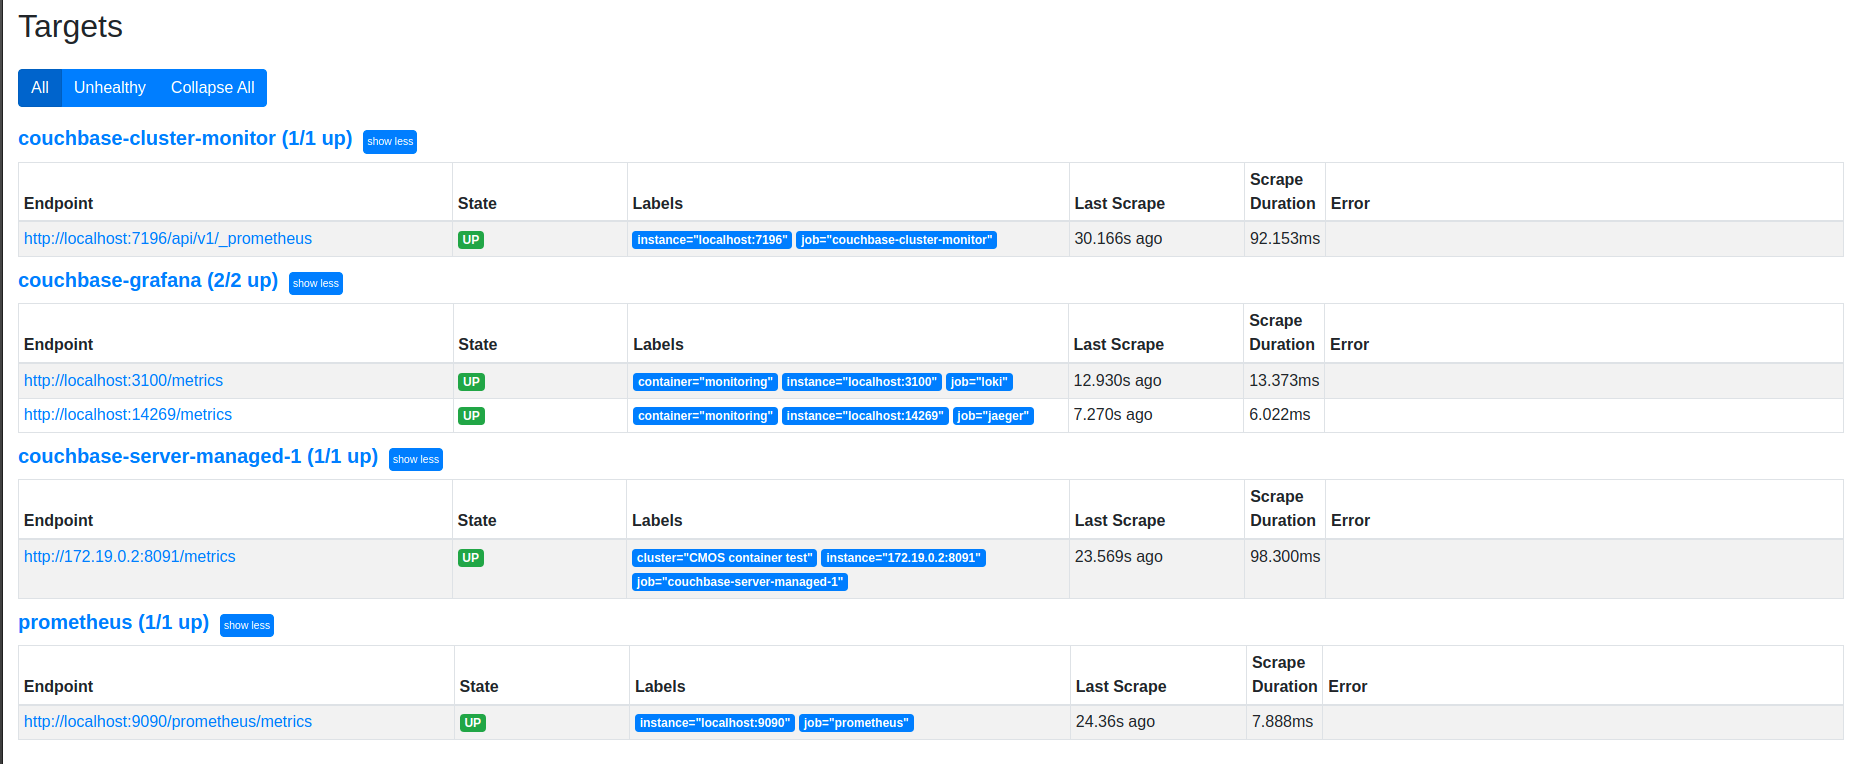
From the landing page, you can go to the prometheus target page and check if the added cluster target is up or down.
Grafana
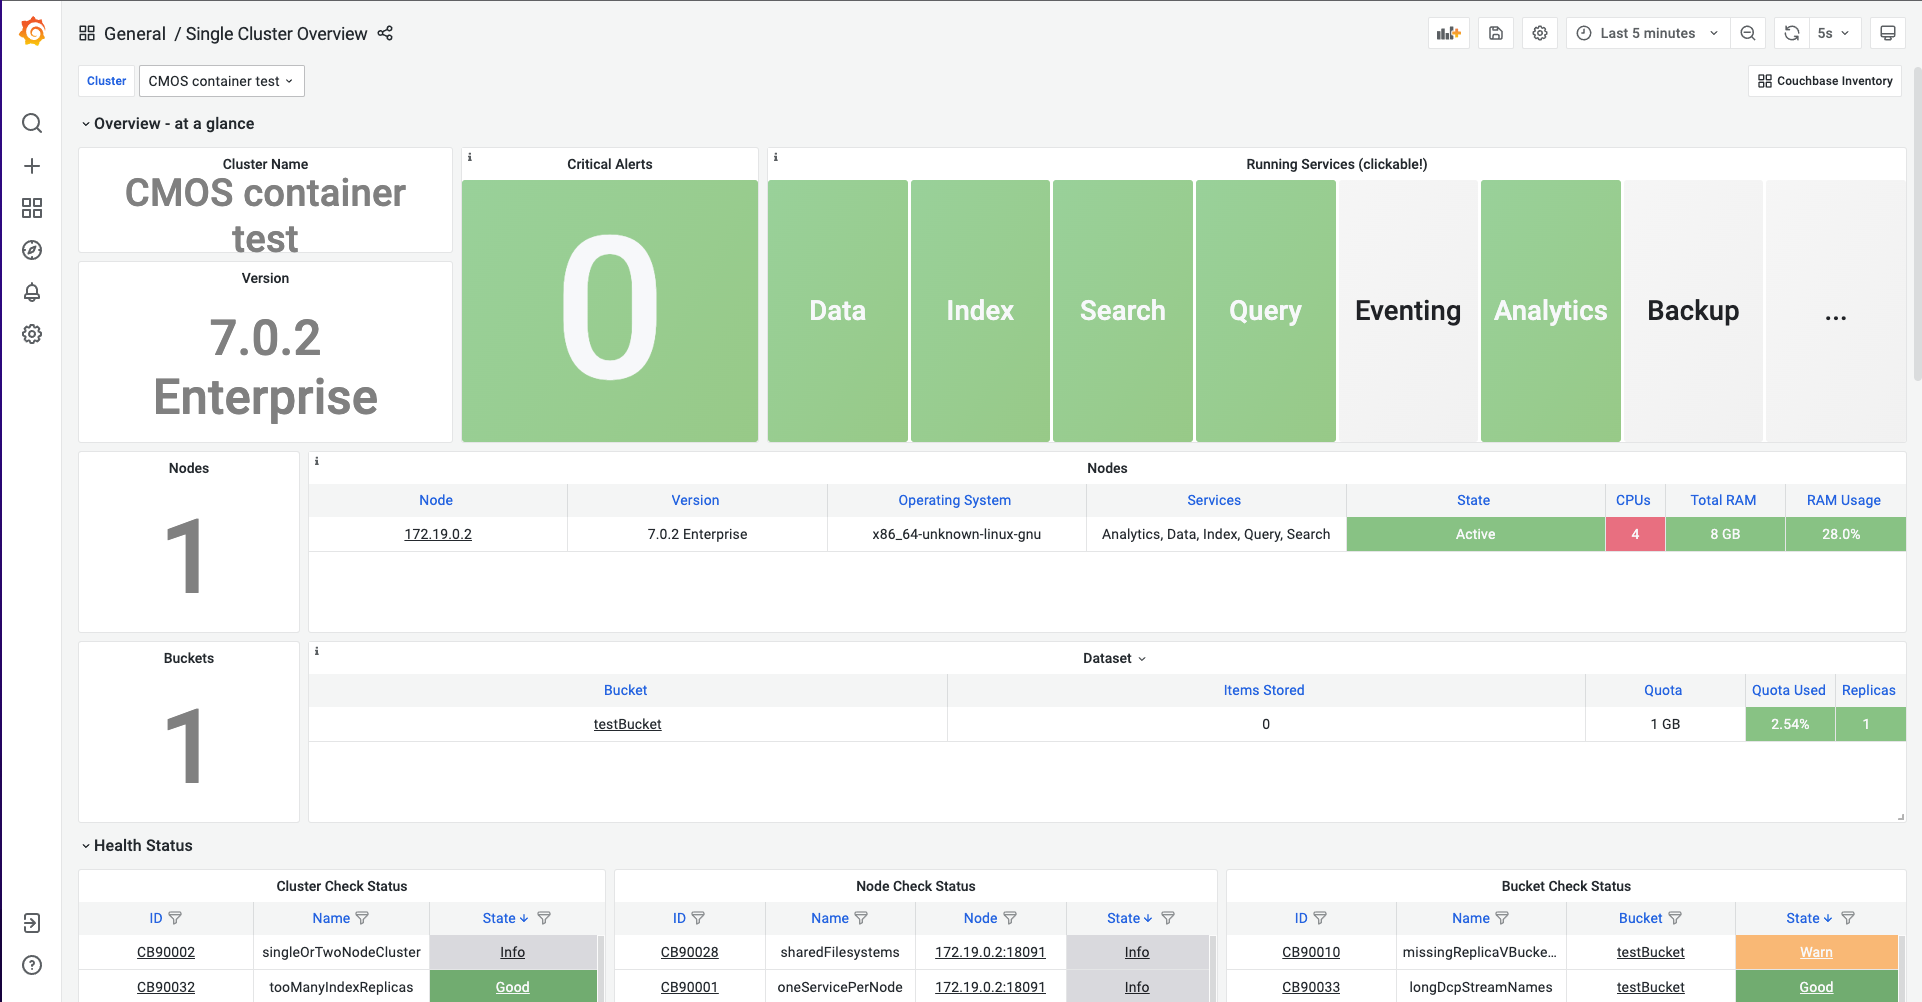
From the landing page, you can go to Grafana and check the graphs.
CMOS comes with pre-installed dashboards to monitor the Couchbase cluster.
Dashboards with tag couchbase-7 are relevant for Couchbase server version 7+.
For more information, check the Grafana configuration section.
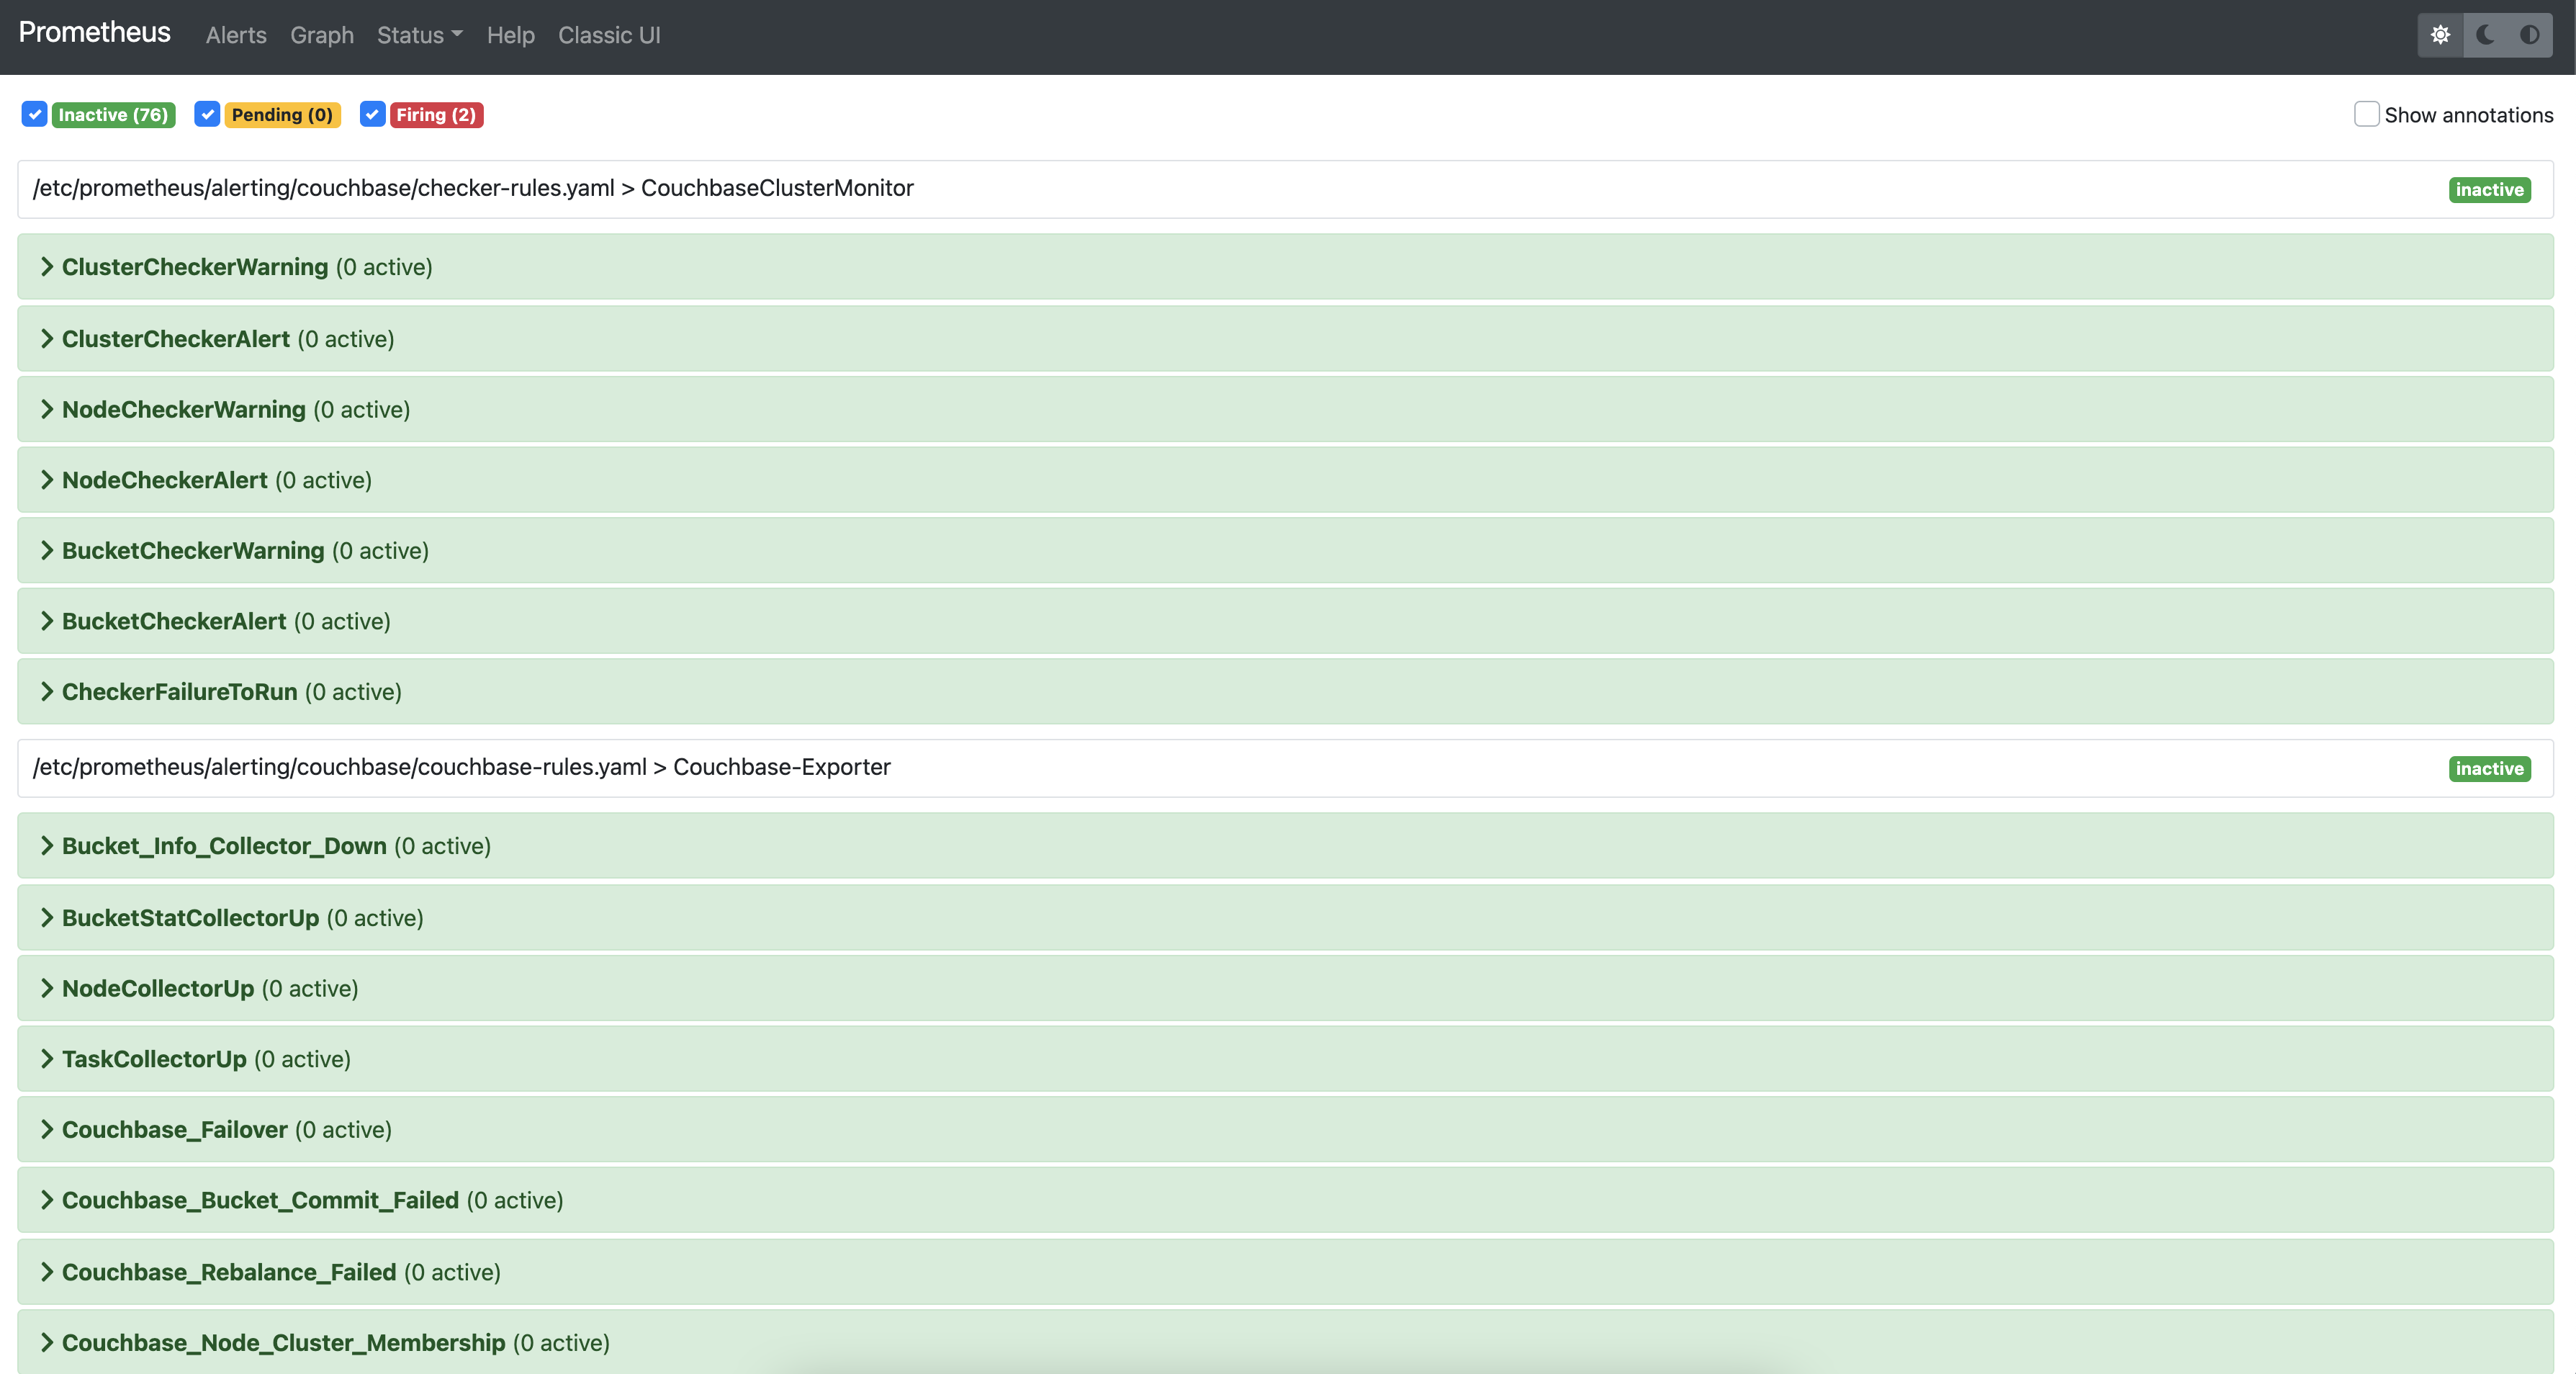
Alerts
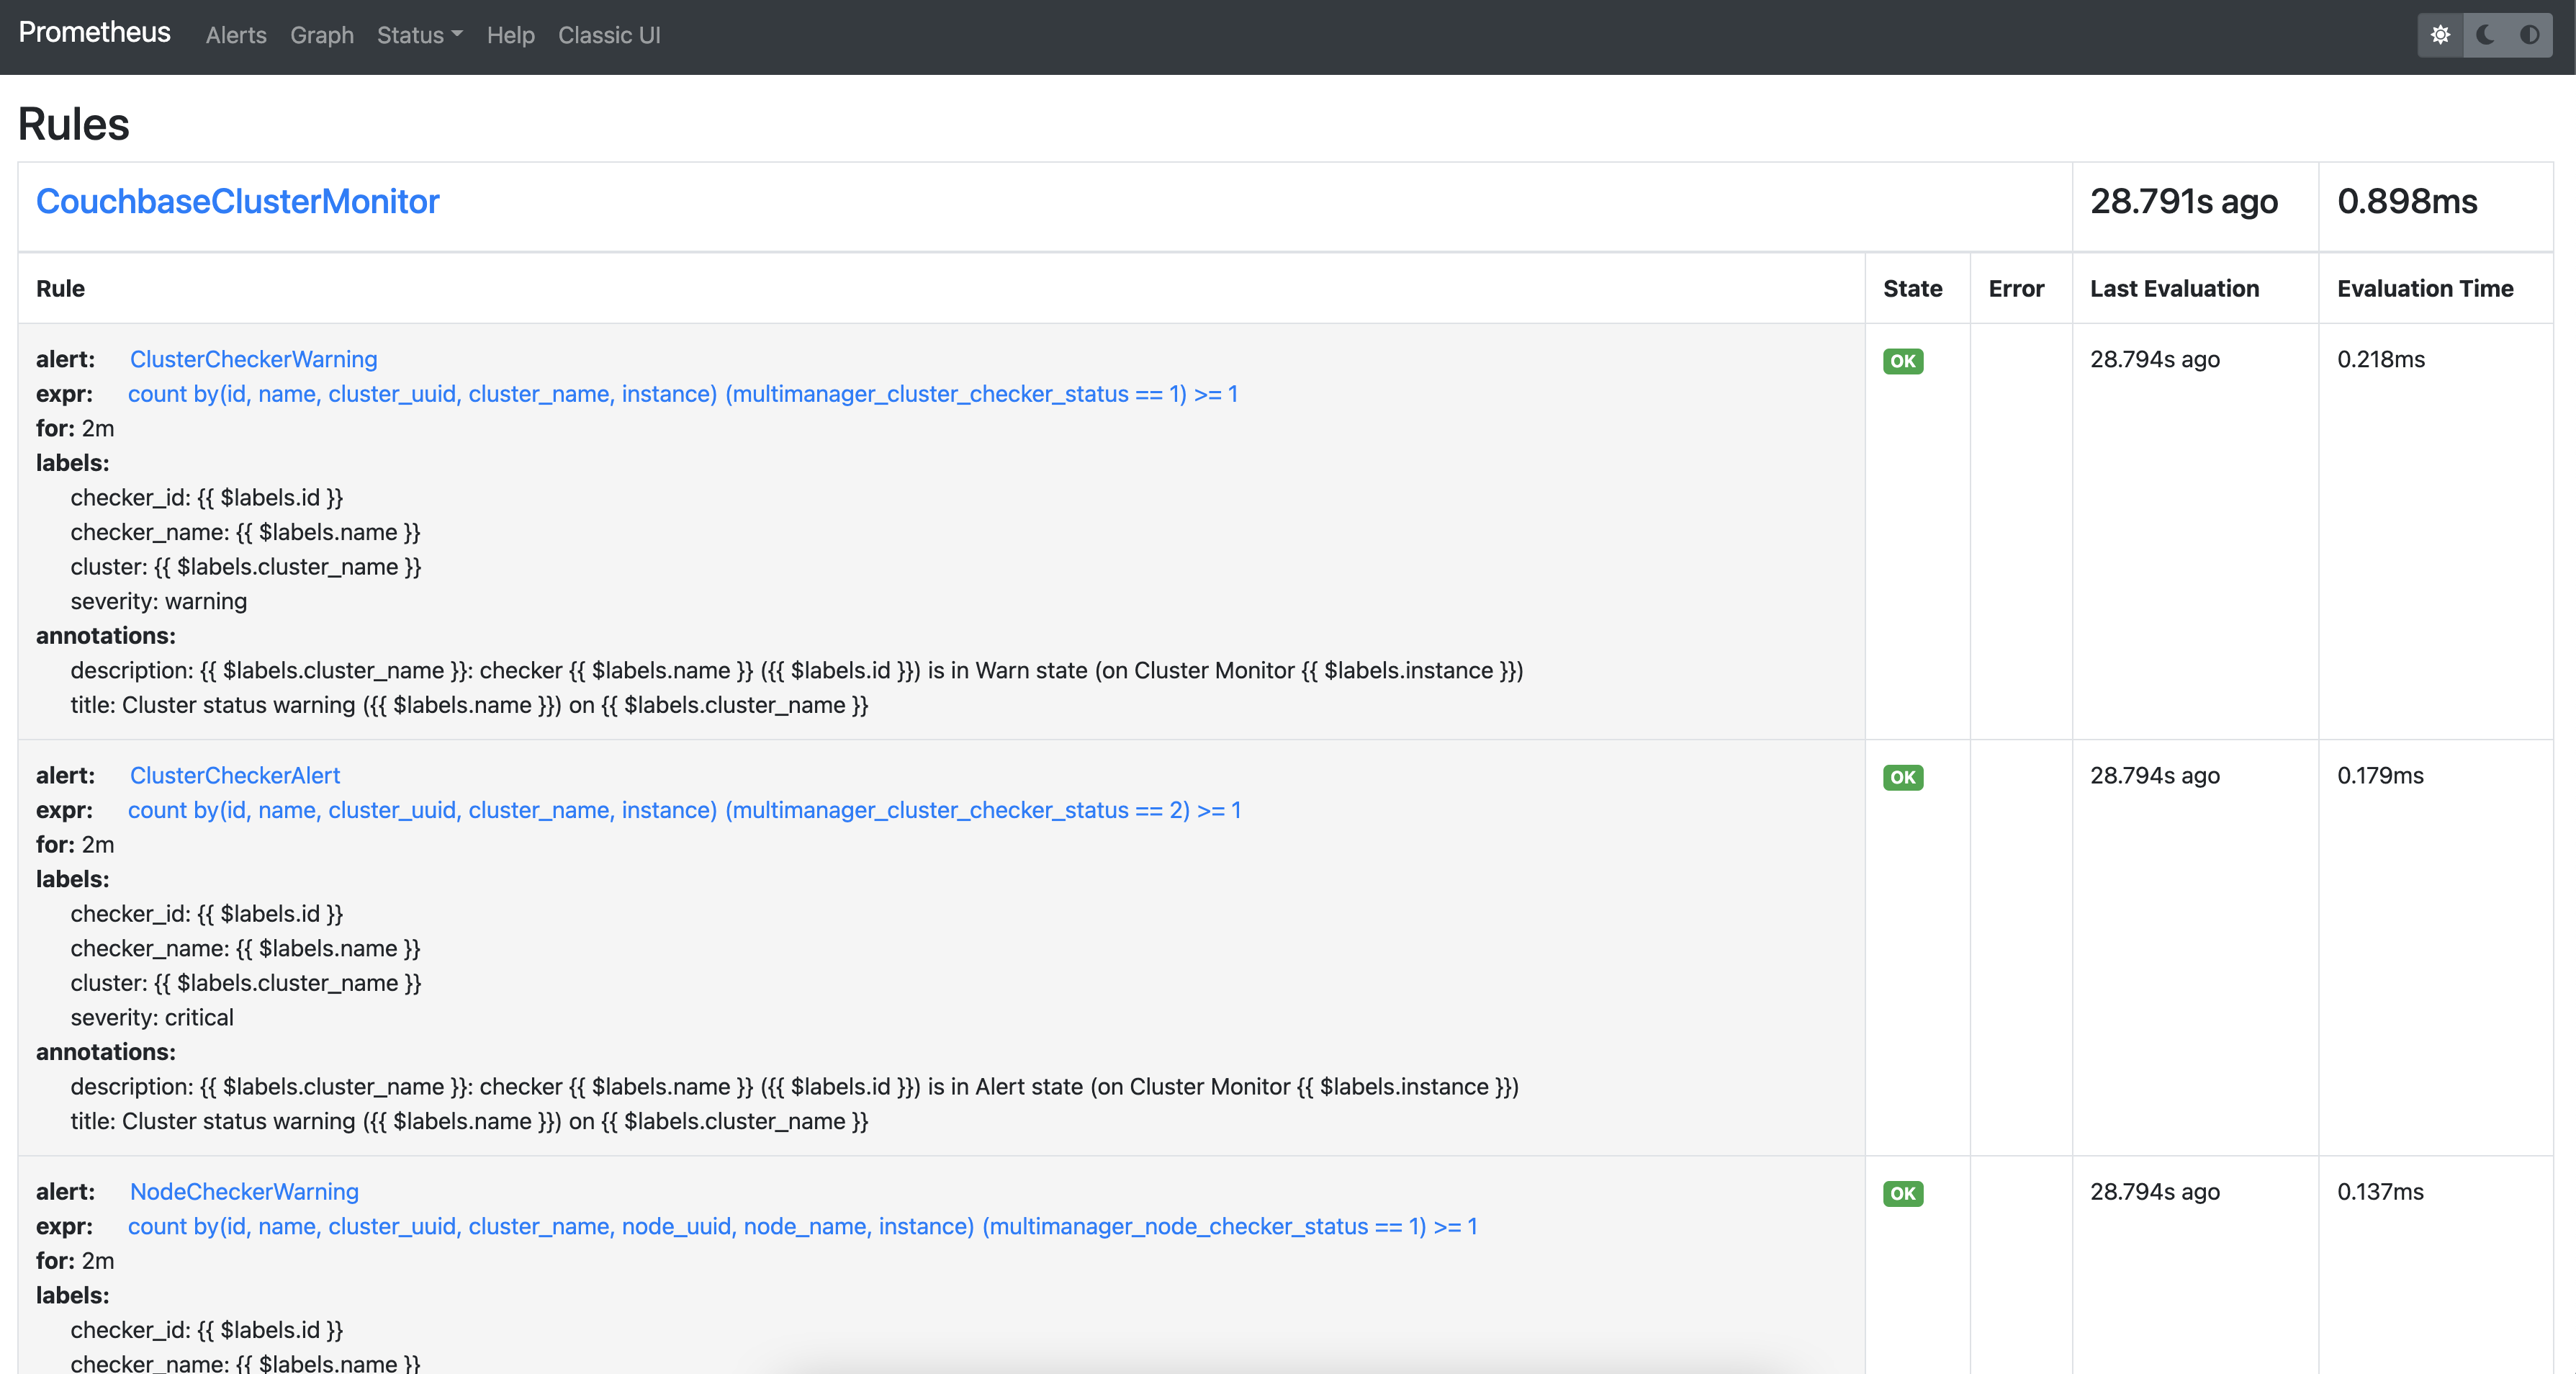
CMOS comes with pre-installed alert rules to monitor the Couchbase cluster. Navigate to the Prometheus UI to see the rules, or Alertmanager to see the alerts. For more information check the prometheus and alerting configuration section.
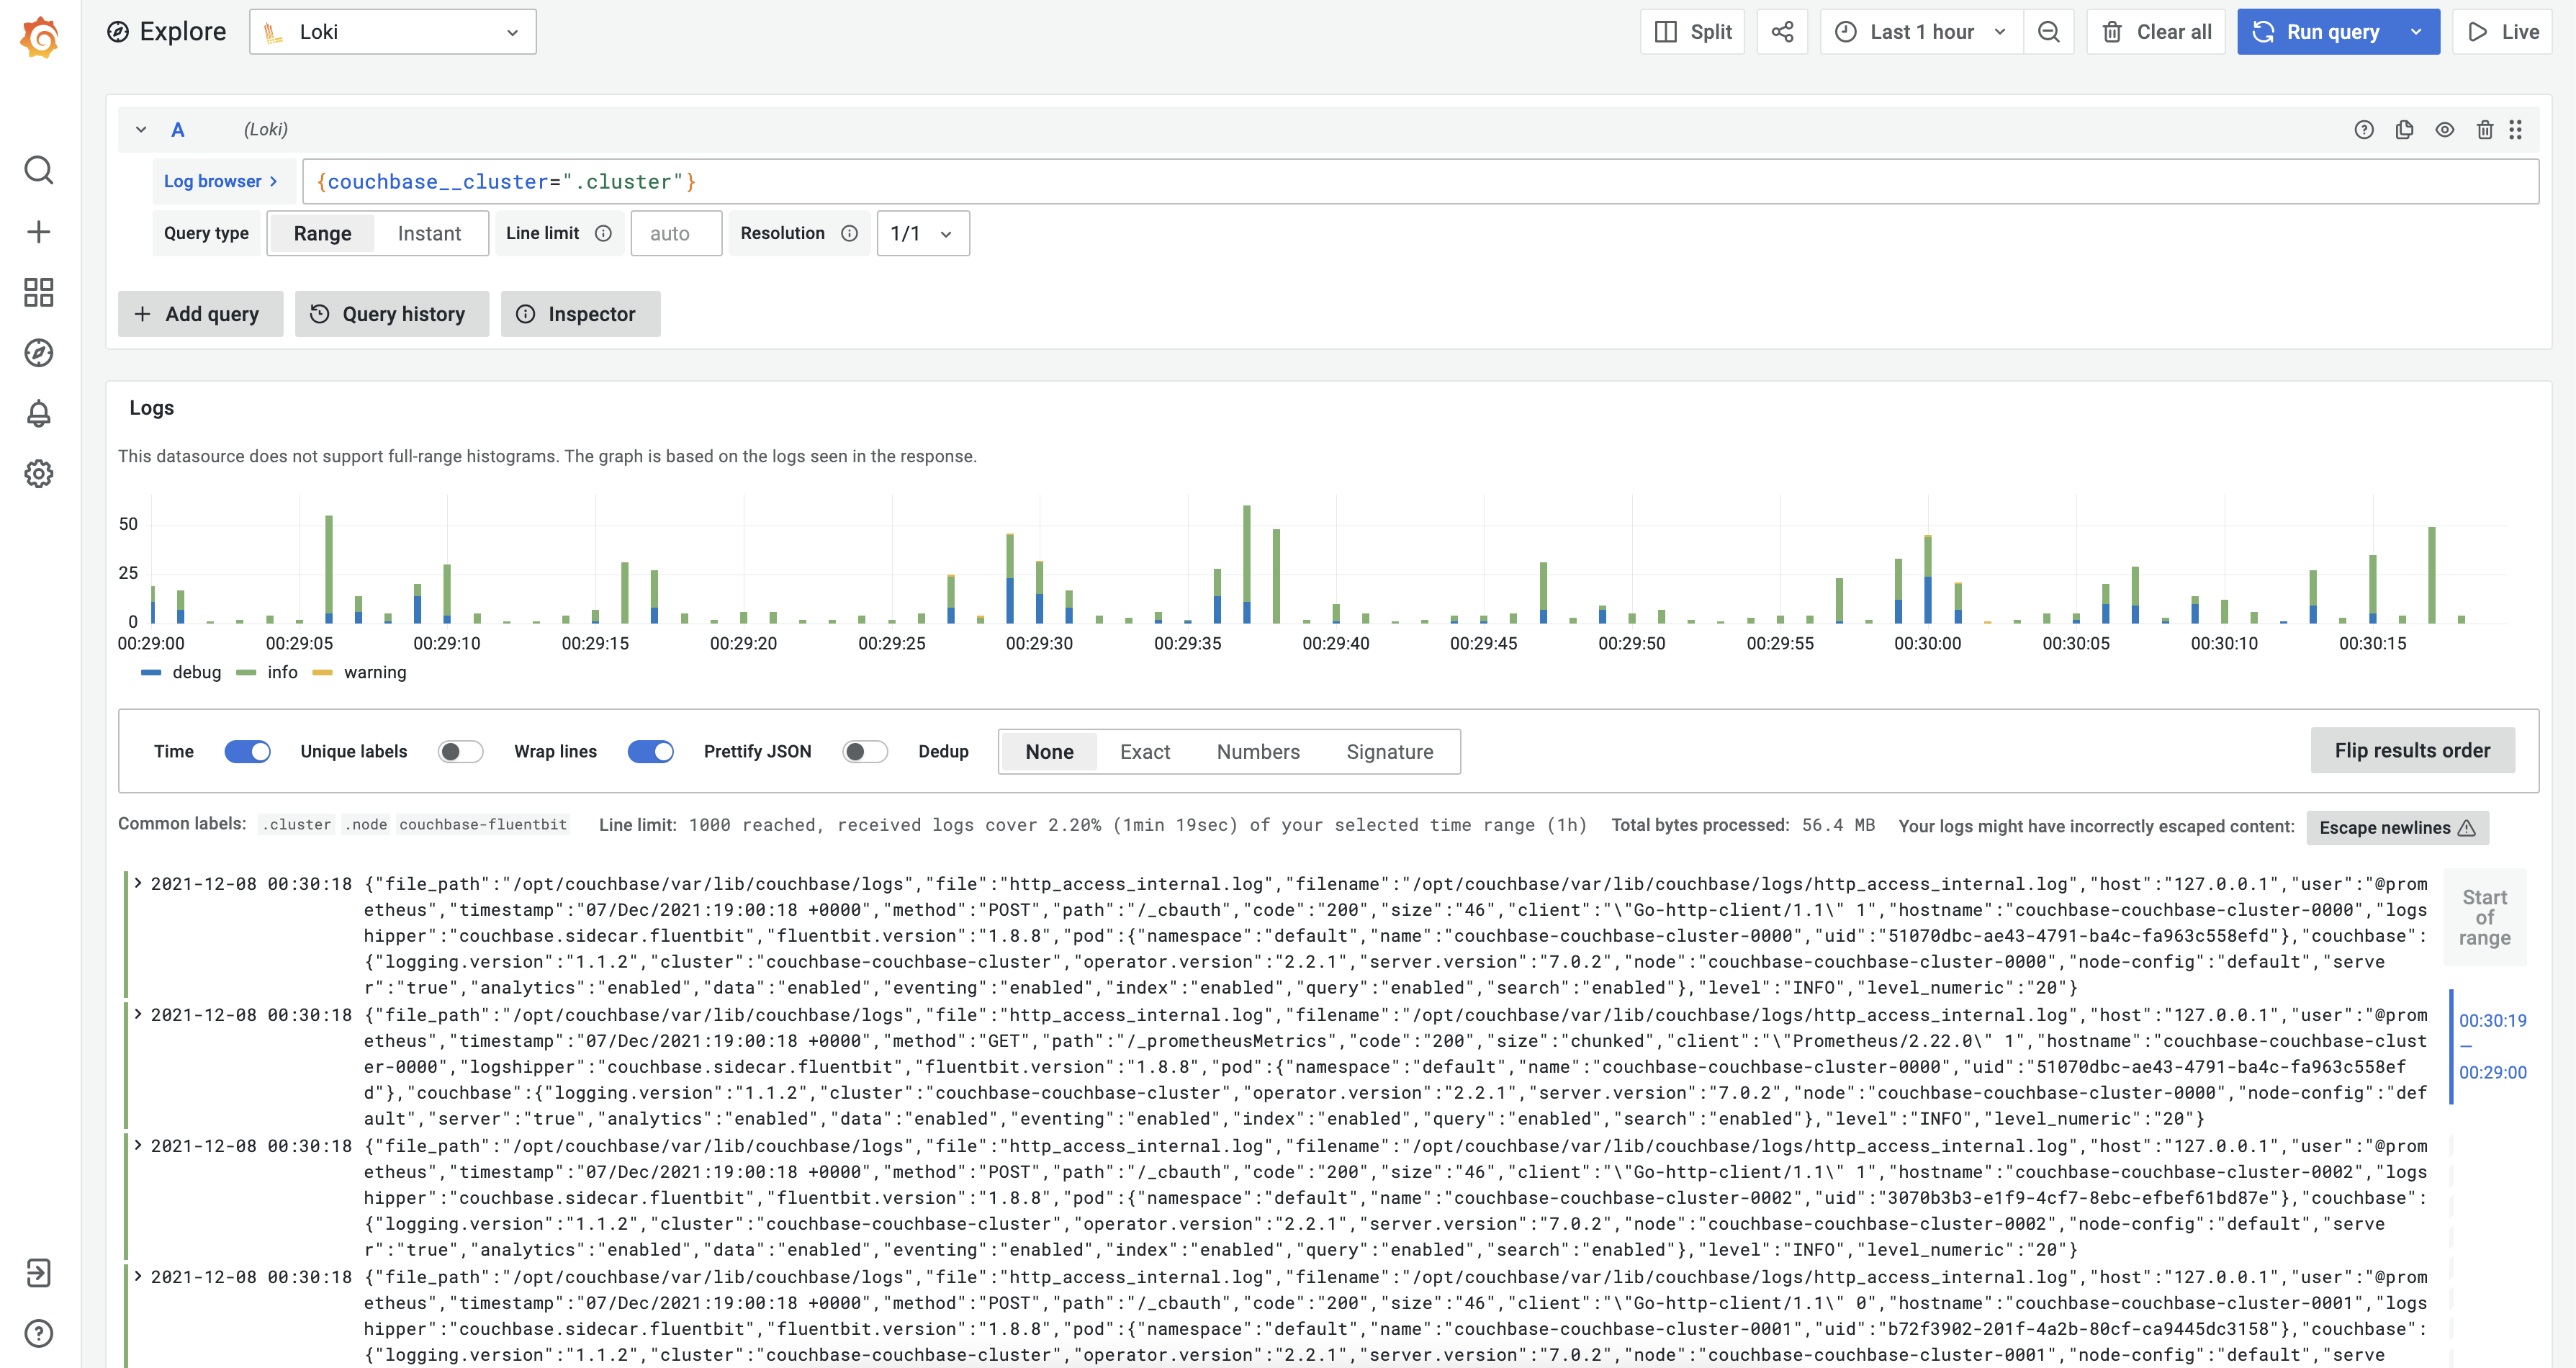
Loki
Loki, which is shipped with Grafana, allows access to logs of various components. You can configure it via Configuration > Data sources > Loki > Explore.
|
You will need to install and configure Fluent Bit on your Couchbase Server nodes before logs will be sent to Loki. Refer to the Fluent Bit install guidance. |
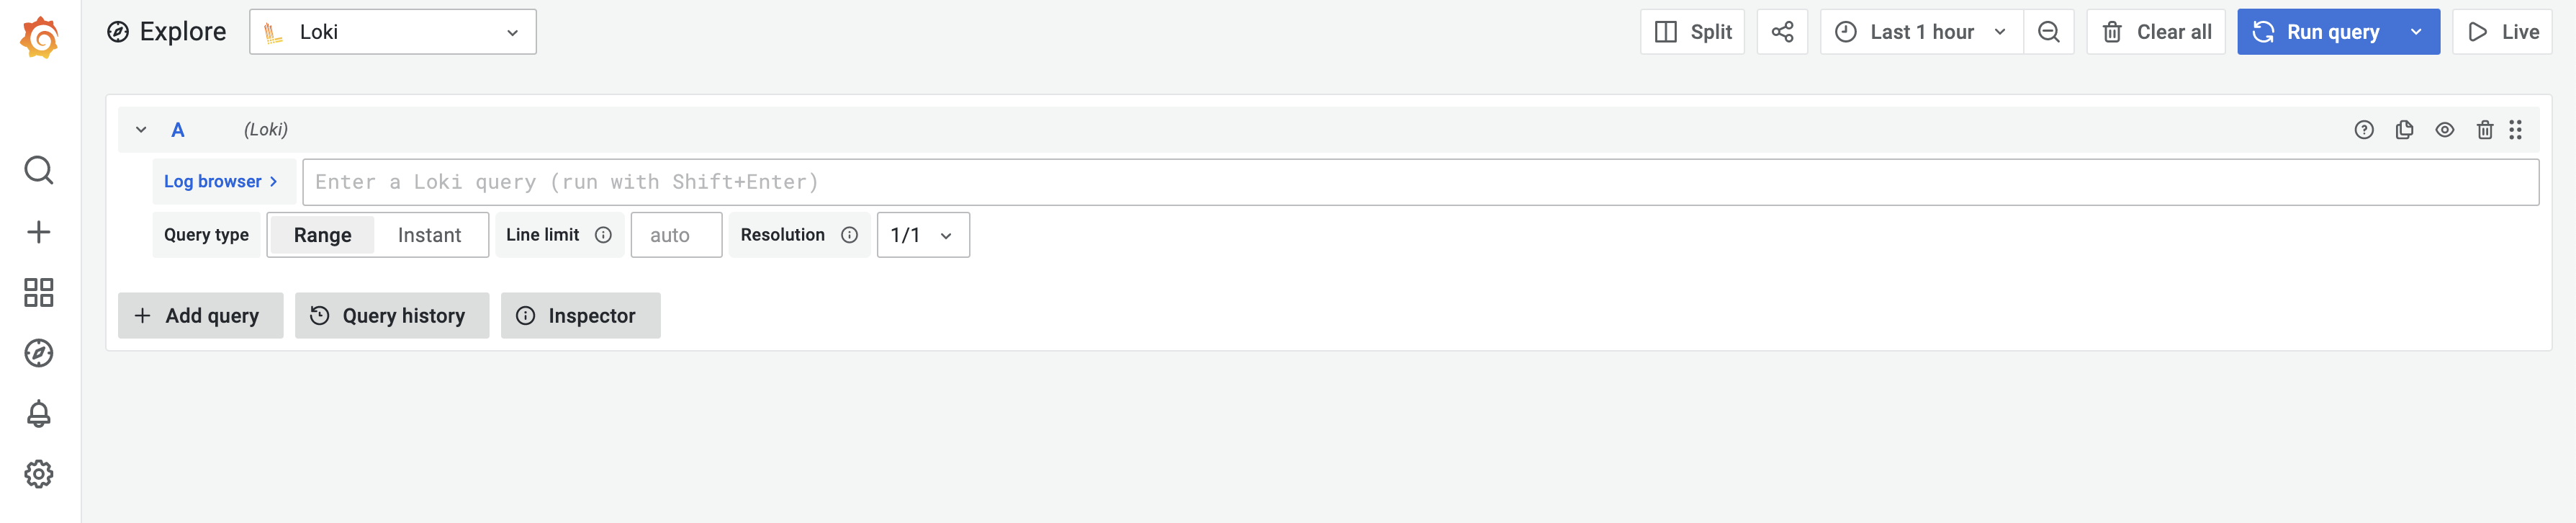
From the Log browser, you can enter a custom Loki query or select appropriate labels to see the logs.
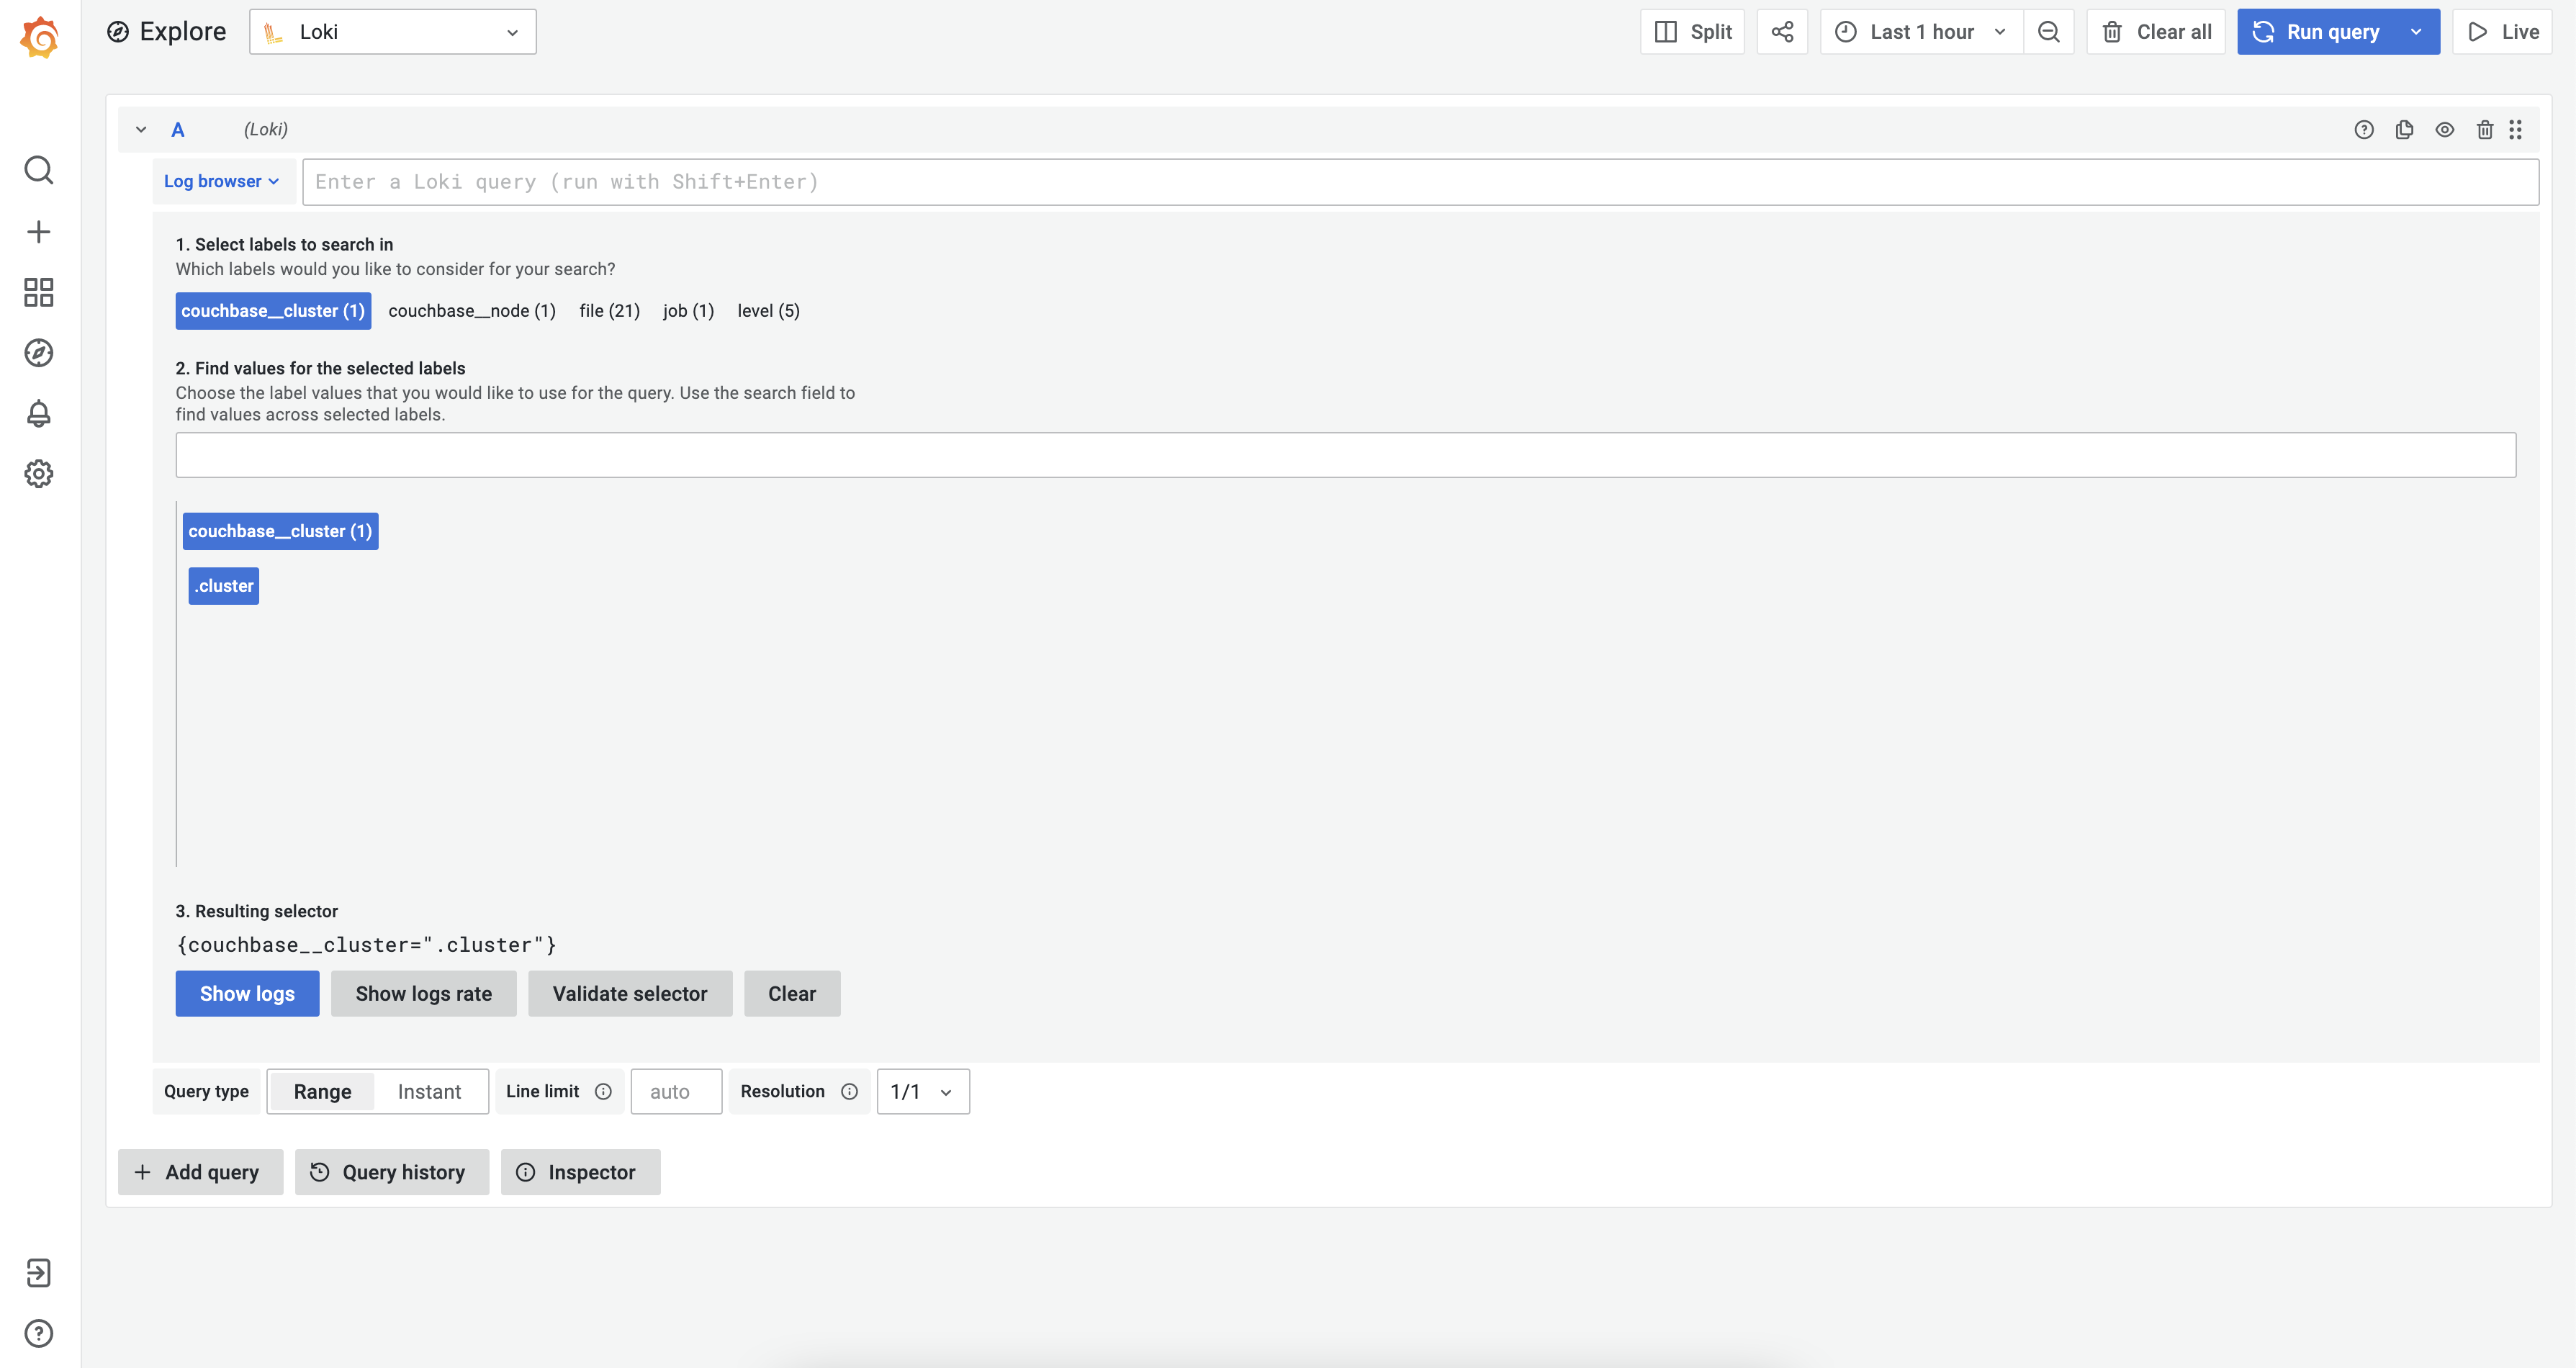
After that select the “Show logs” to view logs. You can also build custom Grafana dashboards based on your needs.