Manage Logging
The Logging facility allows a record to be maintained of important events that occur on Couchbase Server.
Logging Overview
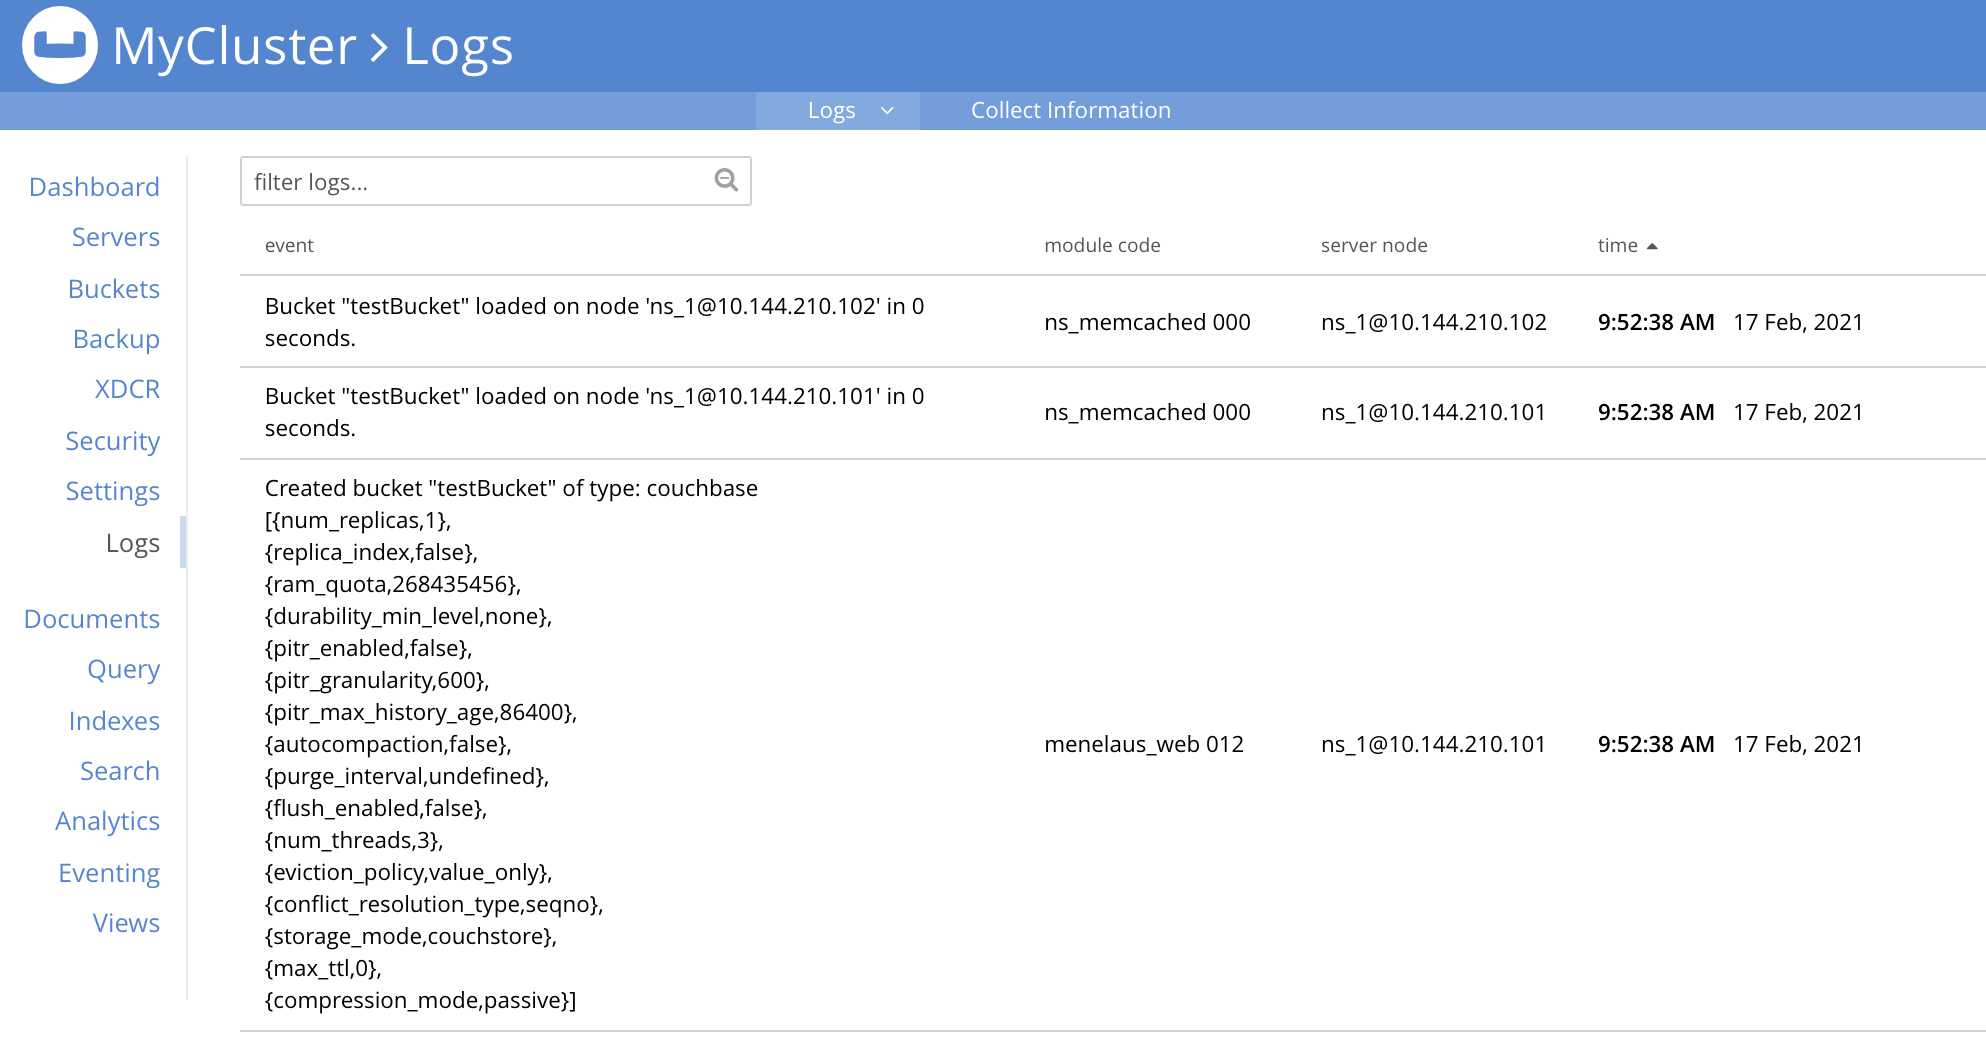
The Couchbase-Server Logging facility records important events, and saves the details to log files, on disk. Additionally, events of cluster-wide significance are displayed on the Logs screen, in Couchbase Web Console. This may appear as follows:

By default, on Linux systems, log files are saved to /opt/couchbase/var/lib/couchbase/logs; on MacOS, to /Users/username/Library/Application Support/Couchbase/var/lib/couchbase/logs; and on Windows, to C:\Program Files\Couchbase\Server\var\lib\couchbase\logs.
Collecting Information
On each node within a Couchbase Server-cluster, logging is performed continuously.
A subset of the results can be reviewed in the Couchbase Web Console Logs screen; while all details are saved to the logs directory, as described above.
(Note that the logs directory may include audit.log.
This is a special log file, used to manage cluster-security, and is handled separately from the other log files.
The information provided throughout the remainder of this page — on collecting, uploading, redacting, and more — does not apply to audit.log.
For information on audit.log, see Auditing.)
Additionally, explicit logging can be performed by the user. This allows comprehensive and fully updated information to be generated as required. The output includes everything currently on disk, together with additional data that is gathered in real time. Explicit logging can either be performed for all nodes in the cluster, or for one or more individual nodes. The results are saved as zip files: each zip file contains the log-data generated for an individual node.
Explicit logging can be performed by means of the Couchbase CLI utility cbcollect_info.
The documentation for this utility, provided
here, includes a complete list of the log files that can be created, and a description of the contents of each.
Additionally, administrators with either the Full Admin or Cluster Admin role can perform explicit logging by means of Couchbase Web Console: on the Logs page, left-click on the Collect Information tab, located near the top. (Note that for administrators without either of these roles, this tab does not appear.)

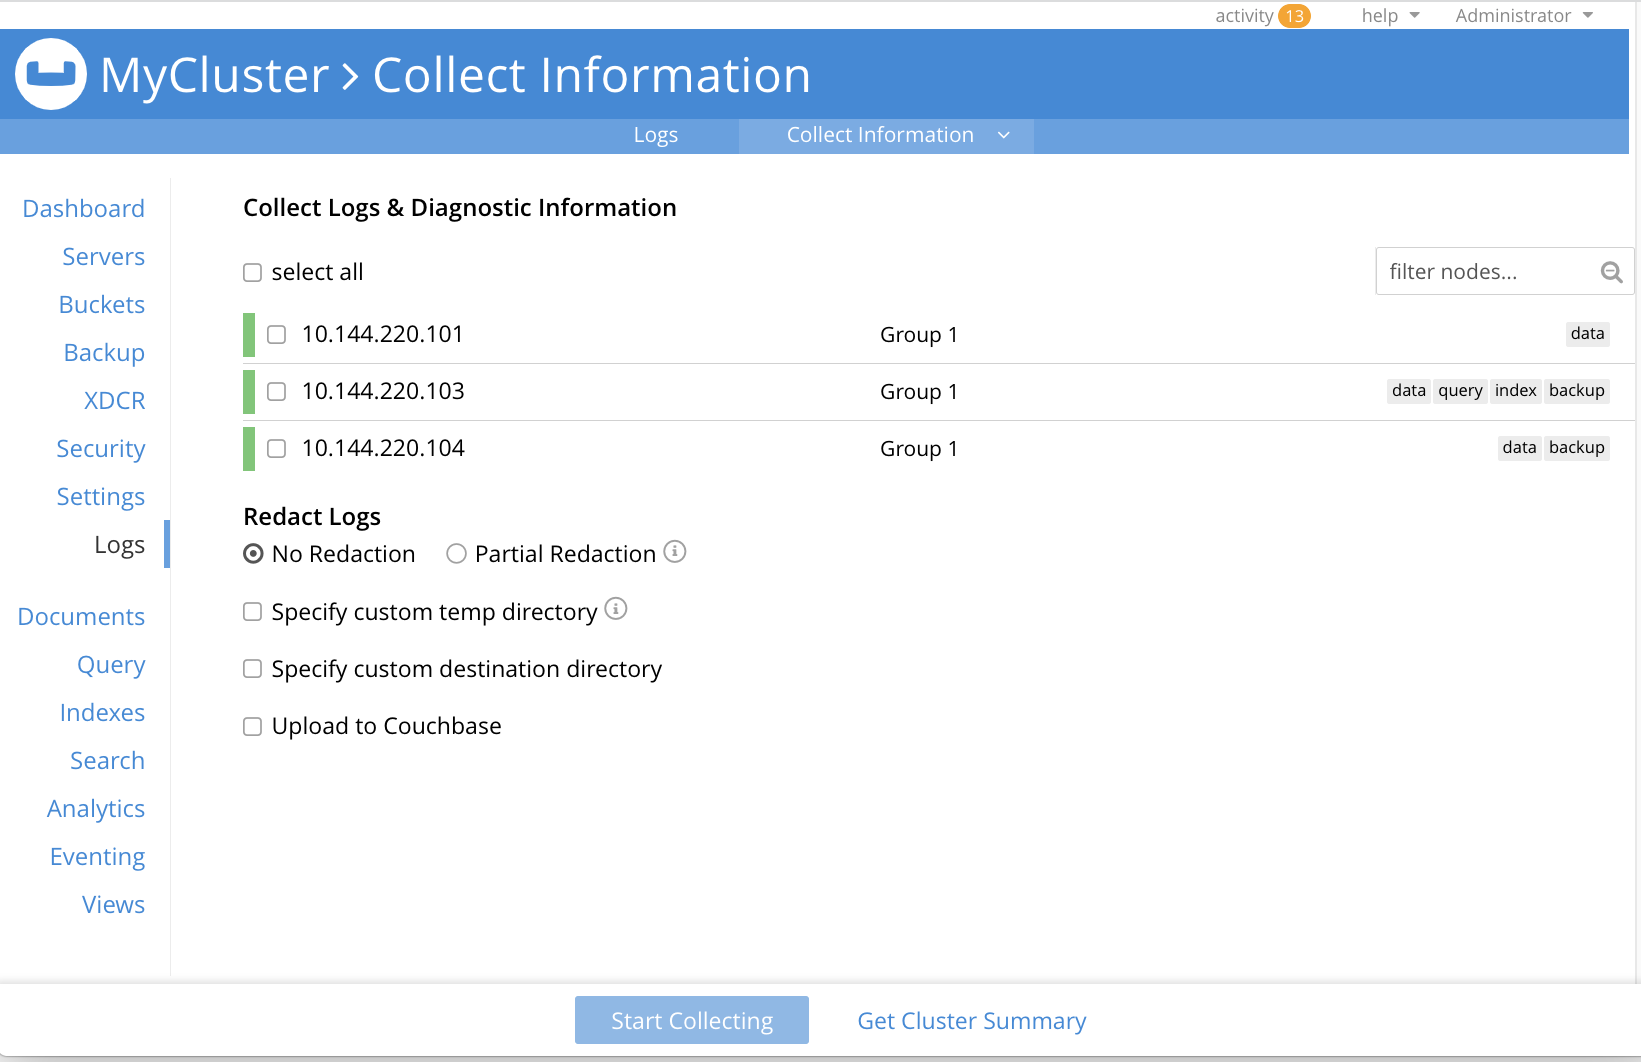
This brings up the Collect Information screen:

This allows logs and diagnostic information to be collected either from all or from selected nodes within the cluster. It also allows, in the Redact Logs panel, a log redaction-level to be specified (this is described in Applying Redaction, below). The Specify custom temp directory checkbox can be checked to specify the absolute pathname of a directory into which data is temporarily saved, during the collection process. The Specify custom destination directory can be checked to specify the absolute pathname of a directory into which the completed zip files are saved.
The Upload to Couchbase checkbox is described in Uploading Log Files, below.
To start the collection-process, left-click on the Start Collecting button. A notification is displayed, indicating that the collection-process is running. A button is provided to allow the collection-process to be stopped, if this should be appropriate. Whenever the collection-process completes for one of the nodes, a notification is displayed, and the collection-process continues, if necessary, for remaining nodes. When the process has completed for all nodes, information is displayed as follows:

As this indicates, a set of log files has been created for each node in the cluster. Each file is saved as a zip file in the stated temporary location.
Uploading Log Files
Log files can be uploaded to Couchbase, for inspection by Couchbase Support.
For information on performing upload at the command-prompt, see cbcollect_info. To upload by means of Couchbase Web Console, before starting the collection-process, check the Upload to Couchbase checkbox:

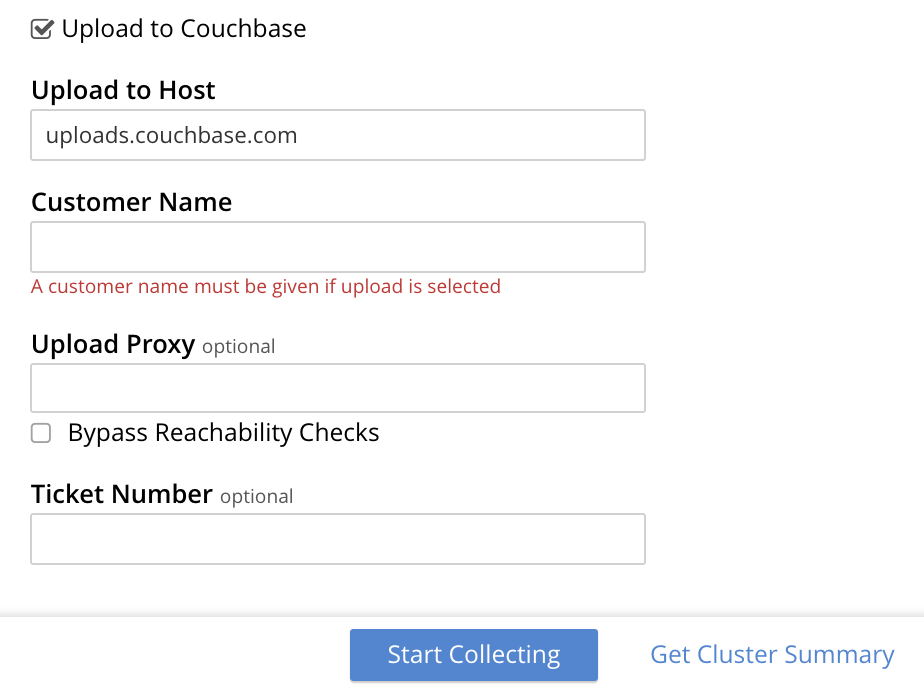
The display changes to the following:

The dialog now features an Upload to Host field, which contains the server-location to which the customer-data is uploaded. Fields are also provided for Customer Name (required) and Ticket Number (optional). The Upload Proxy field optionally takes the hostname of a remote system, which contains the directory specified by the pathname. If the Bypass Reachability Checks checkbox is left unchecked (which is the default), an attempt is made to gather and upload the collected information without the upload specifications (that is, the upload host, customer name, and optionally, upload proxy) being pre-verified. Otherwise, if the checkbox is checked, the upload specifications are submitted for verification before information is collected and attemptedly uploaded: in which case, if the upload specifications cannot be verified, the collection-operation does not proceed, and an error is flagged on the console.
When all required information has been entered, to start information-collection, left-click on the Start Collecting button. When collection and upload have been successfully completed, the URL of the uploaded zip file is displayed.
Getting a Cluster Summary
A summary of the cluster’s status can be acquired by means of the link at the lower right of the Collect Information panel:

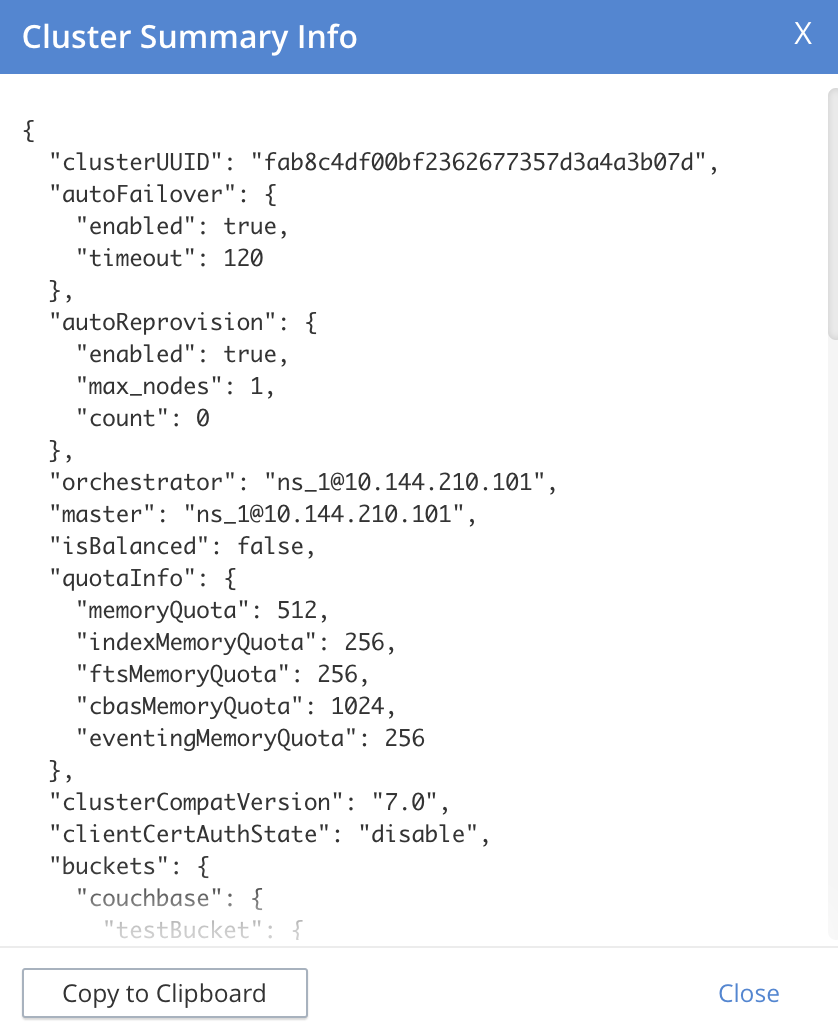
This brings up the Cluster Summary Info dialog:

This displayed JSON document, which contains detailed status on the current configuration and status of the entire cluster, can be copied to the clipboard, by left-clicking on the Copy to Clipboard button, at the lower left. This information can then be manually shared with Couchbase Support; either in addition to, or as an alternative to log-collection.
Understanding Redaction
Optionally, log files can be redacted. This means that user-data, considered to be private, is removed. Such data includes:
-
Key/value pairs in JSON documents
-
Usernames
-
Query-fields that reference key/value pairs and/or usernames
-
Names and email addresses retrieved during product registration
-
Extended attributes
This redaction of user-data is referred to as partial redaction. (Full redaction, which will be available in a forthcoming version of Couchbase Server, additionally redacts meta-data.)
In each modified log file, hashed text (achieved with SHA1) is substituted for redacted text. For example, the following log file fragment displays private data — a Couchbase username:
0ms [I0] {2506} [INFO] (instance - L:421) Effective connection string:
couchbase://127.0.0.1?username=Administrator&console_log_level=5&;.
Bucket=default
The redacted version of the log file might appear as follows:
0ms [I0] {2506} [INFO] (instance - L:421) Effective connection string:
<UD>e07a9ca6d84189c1d91dfefacb832a6491431e95</UD>.
Bucket=<UD>e16d86f91f9fd0b110be28ad00e348664b435e9e</UD>
Note that redaction may eliminate some parameters containing non-private data, as well as all parameters containing private.
Note also that redaction of log files may have one or both of the following consequences:
-
Logged issues will be found harder to diagnose, by both the user and Couchbase Support.
-
Log-collection is significantly more time-consumptive, since redaction is performed at collection-time.
Applying Redaction
Redaction of log files saved on the cluster can be applied as required, when performing explicit logging, by means of either cbcollect_info or the Logs facility of Couchbase Web Console.
For information on performing explicit logging with redaction at the command-prompt, see cbcollect_info.
To perform explicit logging with redaction by means of Couchbase Web Console, before starting the collection-process, access the Redact Logs panel, on the Collect Information screen. This features two radio-buttons, labeled No Redaction and Partial Redaction. Make sure the Partial Redaction radio-button is selected. Guidance on redaction is displayed below it:

Left-click on the Start Collecting button. A notification explains that the collection-process is now running. When the process has completed, a further notification appears, specifying the location (local or remote) of each created zip file. Note that, when redaction has been specified, two zip files are provided for each node: one file containing redacted data, the other unredacted data.
Redacting Log Files Outside the Cluster
Certain Couchbase technologies — such as cbbackupmgr, the SDK, connectors, and Mobile — create log files saved outside the Couchbase Cluster.
These can be redacted by means of the command-line tool cblogredaction.
Multiple log files can be specified simultaneously.
Each file must be specified as plain text.
Optionally, the salt to be used can be automatically generated.
For example:
$ cblogredaction /Users/username/testlog.log -g -o /Users/username -vv
2018/07/17T11:27:06 WARNING: Automatically generating salt. This will make it difficult to cross reference logs
2018/07/17T11:27:07 DEBUG: /Users/username/testlog.log - Starting redaction file size is 19034284 bytes
2018/07/17T11:27:07 DEBUG: /Users/username/testlog.log - Log redacted using salt: <ud>COeAtexHB69hGEf3</ud>
2018/07/17T11:27:07 INFO: /Users/username/testlog.log - Finished redacting, 50373 lines processed, 740 tags redacted, 0 lines with unmatched tags
For more information, see the corresponding man page, or run the command with the --h (help) option.
Log File Locations
Couchbase Server creates log files in the following locations.
| Platform | Location |
|---|---|
Linux |
/opt/couchbase/var/lib/couchbase/logs |
Windows |
C:\Program Files\Couchbase\Server\var\lib\couchbase\logs Assumes default installation location |
Mac OS X |
/Users/<username>/Library/Application Support/Couchbase/var/lib/couchbase/logs |
Log File Listing
The following table lists the log files to be found on Couchbase Server.
Unless otherwise specified, each file is named with the .log extension.
| File | Log Contents |
|---|---|
|
Security audit log for administrators. |
|
Troubleshooting log for the babysitter process which is responsible for spawning all Couchbase Server processes and respawning them where necessary. |
|
Log for Backup Service; containing entries at |
|
Troubleshooting log for the |
|
Debug-level troubleshooting for the Cluster Manager. |
|
Error-level troubleshooting log for the Cluster Manager. |
|
Troubleshooting log for the Eventing Service. |
|
Troubleshooting log for the Search Service. |
|
Troubleshooting log for XDCR source activity. |
|
The admin access log records server requests (including administrator logins) to the REST API or Couchbase Web Console. It is output in common log format and contains several important fields such as remote client IP, timestamp, GET/POST request and resource requested, HTTP status code, and so on. |
|
The admin access log records internal server requests (including administrator logins) to the REST API or Couchbase Web Console. It is output in common log format and contains several important fields such as remote client IP, timestamp, GET/POST request and resource requested, HTTP status code, and so on. |
|
Troubleshooting log for the Index Service. |
|
Log containing statistics related to the Index Service. |
|
Info-level troubleshooting log for the Cluster Manager. |
|
Log used by the cluster manager. |
|
JavaScript and other view-processing errors are reported in this file. |
|
Contains information relating to the core memcached component, including DCP stream requests and slow operations. |
|
Troubleshooting log for the |
|
Contains information related to starting up the |
|
Troubleshooting log for the projector process which is responsible for sending appropriate mutations from Data Service nodes to Index Service nodes. |
|
Log for the instance of Prometheus that runs on the current node, supporting the gathering and management of Couchbase-Server metrics . (See the Metrics Reference, for more information.) |
|
Troubleshooting log for the Query Service. |
|
Contains reports on rebalances that have occurred.
Up to the last five reports are maintained.
Each report is named in accordance with the time it was run: for example, |
|
Contains progress and crash reports for the Erlang processes. Due to the nature of Erlang, processes crash and restart upon an error. |
|
Troubleshooting log for the ssl proxy spawned by the Cluster Manager. |
|
Contains periodic statistic dumps from the Cluster Manager. |
|
Troubleshooting log for the views engine, predominantly focusing on the changing of partition states. |
|
Troubleshooting log for data received from XDCR sources. |
|
Information on access attempts made to the REST/HTTP port of the Analytics Service. |
|
Debugging information, related to the Analytics Service. |
|
DCP-specific debugging information related to the Analytics Service. |
|
Information on documents that have failed to be imported/ingested from the Data Service into the Analytics Service. |
|
Events logged by the Analytics Service at the DEBUG logging level. |
|
Events logged by the Analytics Service at the ERROR logging level. |
|
Events logged by the Analytics Service at the INFO logging level. |
|
Information concerning the shutting down of the Analytics Service. |
|
Events logged by the Analytics Service at the WARN logging level. |
Log File Rotation
The memcached log file is rotated when it has reached 10MB in size; twenty rotations being maintained — the current file, plus nineteen compressed rotations.
Other logs are automatically rotated after they have reached 40MB in size; ten rotations being maintained — the current file, plus nine compressed rotations.
To provide custom rotation-settings for each component, add the following to the static_config file:
{disk_sink_opts_disk_debug,
        [{rotation, [{size, 10485760},
        {num_files, 10}]}]}.
This rotates the debug.log at 10MB, and keeps ten copies of the log: the current log and nine compressed logs.
Log rotation settings can be changed. Note, however, that this is not advised; and that only the default log rotation settings are supported by Couchbase.
Changing Log File Locations
The default log location on Linux systems is /opt/couchbase/var/lib/couchbase/logs. The location can be changed. Note, however, that this is not advised; and that only the default log location is supported by Couchbase.
To change the location, proceed as follows:
-
Log in as
rootorsudoand navigate to the directory where Couchbase Server is installed. For example:/opt/couchbase/etc/couchbase/static_config. -
Edit the static_config file: change the
error_logger_mf_dirvariable, specifying a different directory. For example:{error_logger_mf_dir, "/home/user/cb/opt/couchbase/var/lib/couchbase/logs"} -
Stop and restart Couchbase Server. See Startup and Shutdown.
Changing Log File Levels
The default logging level for all log files is debug, except for couchdb, which is set to info.
Logging levels can be changed.
Note, however, that this is not advised; and that only the default logging levels are supported by Couchbase.
Either persistent or dynamic changes can be made to logging levels.
Persistent Changes
Persistent means that changes continue to be implemented, should a Couchbase Server reboot occur. To make a persistent change on Linux systems, proceed as follows:
-
Log in as
rootorsudo, and navigate to the directory where you installed Couchbase. For example:/opt/couchbase/etc/couchbase/static_config. -
Edit the static_config file and change the desired log component. (Parameters with the
loglevel_prefix establish logging levels.) -
Stop and restart Couchbase Server. See Startup and Shutdown.
Dynamic Changes
Dynamic means that if a Couchbase Server reboot occurs, the changed logging levels revert to the default.
To make a dynamic change, execute a curl POST command, using the following syntax:
curl -X POST -u adminName:adminPassword HOST:PORT/diag/eval \
              -d 'ale:set_loglevel(<log_component>,<logging_level>).'
-
log_component: The default log level (exceptcouchdb) isdebug; for examplens_server. The available loggers arens_server,couchdb,user,Menelaus,ns_doctor,stats,rebalance,cluster, views,mapreduce_errors, xdcr anderror_logger. -
logging_level: The available log levels aredebug,info,warn, anderror.curl -X POST -u Administrator:password http://127.0.0.1:8091/diag/eval \ -d 'ale:set_loglevel(ns_server,error).'
Collecting Logs Using the CLI
To collect logs, use the CLI command cbcollect_info.
To start and stop log-collection, and to collect log-status, use:
Collecting Logs Using the REST API
The Logging REST API provides the endpoints for retrieving log and diagnostic information.
To retrieve log information use the /diag and /sasl_logs
REST endpoints.
Adjusting Threshold for Logging Slow Operations
It is possible to examine and/or alter the logging threshold for slow-running operations.
This is done using the mcctl command that comes packaged with the Couchbase server installation.
The command only gets or sets information for the node it’s run on.
Getting Threshold Details
The current settings are retrieved by using the mcctl cli to execute the get sla command:
|
These settings only apply to the nodes where the changes are made. You must implement the changes on each node to ensure they are applied across the cluster. You must also configure the node to run the |
/opt/couchbase/bin/mcctl --host localhost -u Administrator -P password \
get sla{"comment":"Current MCBP SLA configuration",
"version":1,
"default":{"slow":"500 ms"}},
"COMPACT_DB":{"slow":"1800 s"},
"DELETE_BUCKET":{"slow":"10 s"},
"SEQNO_PERSISTENCE":{"slow":"30 s"}
}The JSON message returned gives details of the operation being logged and the threshold time that will cause a timing message to be logged.
Setting the Threshold
The mcctl command line interface is also used to set the thresholds for the memcahe operations:
/opt/couchbase/bin/mcctl --host localhost -u Administrator -P password \
set sla '{"version":1, "DELETE_BUCKET":{"slow":"100 ms"}}'
In this example, the threshold for the DELETE_BUCKET operation is being set to 100ms. If a bucket deletion operation takes longer than this, then an message will be logged.
|
As an added minor convenience, the time interval can also be specified without a space: |
It is also possible to set the threshold for all the op-codes in a single command by using the default code:
/opt/couchbase/bin/mcctl --host localhost -u Administrator -P password \
set sla '{"version":1, "default":{"slow":"100 ms"}}'Setting the threshold values is non-persistent: when the node is restarted, the thresholds are reset to their default values.
Setting Threshold Defaults
The default values are loaded from the file: /opt/couchbase/etc/couchbase/kv/opcode-attributes.json when the node is started.
{
  "comment": "Default configuration file. Do not edit, but override the settings in opcode-attributes.d/",
  "version": 1,
  "default": {
    "slow": "500 ms"
  },
  "compact_db": {
    "slow": "30 m"
  },
  "create_bucket": {
    "slow": "70 ms"
  },
  "select_bucket": {
    "slow": "10 ms"
  },
  "delete_bucket": {
    "slow": "10 s"
  },
  "seqno_persistence": {
    "slow": "30 s"
  }
}
These values can be overriden by creating another file in the /opt/couchbase/etc/couchbase/kv/opcode-attributes.d directory.
The easiest way to do this is to copy the existing settings file into the directory, making sure that there isn’t an existing file in the directory:
cd /opt/couchbase/etc/couchbase/kv/

cp opcode-attributes.json opcode-attributes.d
Edit /opt/couchbase/etc/couchbase/kv/opcode-attributes.d/opcode-attributes.json with the new settings.
| These settings only apply to the node where the changes are made. To change the threshold across the cluster, then all the configurations must be applied to each node. |